the Creative Commons Attribution 4.0 License.
the Creative Commons Attribution 4.0 License.
Energetic electron enhancements under the radiation belt (L < 1.2) during a non-storm interval on 1 August 2008
Alexei V. Dmitriev
Vladimir A. Parkhomov
An unusual event of deep injections of >30 keV electrons from the radiation belt to low L shells (L<1.2) in the midnight–dawn sector was found from NOAA/POES observations during quiet geomagnetic conditions on 1 August 2008. Using THEMIS observations in front of the bow shock, we found transient foreshock conditions and interplanetary magnetic field (IMF) discontinuities passing the subsolar region at that time. These conditions resulted in generation of plasma pressure pulses and fast plasma jets observed by THEMIS, respectively, in the foreshock and magnetosheath. Signatures of interactions of pressure pulses and jets with the magnetopause were found in THEMIS and GOES measurements in the dayside magnetosphere and ground magnetogram records from INTERMAGNET. The jets produce penetration of hot magnetosheath plasma into the dayside magnetosphere, as was observed by the THEMIS probes after approaching the magnetopause. High-latitude precipitations of the hot plasma were observed by NOAA/POES satellites on the dayside. The precipitations preceded the >30 keV electron injections at low latitudes. We propose a scenario of possible association between the phenomena observed. However, the scenario cannot be firmly supported because of the lack of experimental data on electric fields at the heights of electron injections. This should be a subject of future experiments.
- Article
(12844 KB) - Full-text XML
-
Supplement
(690 KB) - BibTeX
- EndNote
Deep injections of tens to hundreds of keV particles into the inner radiation belt, i.e. drift shells L<3, during quiet or weak geomagnetic activity have recently become one of the main issues of radiation belt dynamics (e.g. Park et al., 2010; Zhao and Li, 2013; Turner et al., 2017). Injection or transport of particles implies violation of adiabatic motion and changing of an L shell. The cause of non-storm injections has not yet been understood.
The mechanisms responsible for the violation of adiabatic motion of energetic particles at low L were a subject of recent studies. The studies presented some intriguing challenges for current models of energetic particle injections. Observations showed that tens to hundreds of keV electrons penetrate deeper than MeV-energy electrons (e.g. Zhao and Li, 2013). The keV-energy electrons can often penetrate down to the slot region separating the inner and outer radiation belts (L ∼ 2.5–3.5) and into the inner radiation belt at L<2 (e.g. Turner et al., 2017). Moreover, the deepest penetrations of energetic electrons were revealed even below the inner radiation belt at L<1.2 (Asikainen and Mursula, 2005; Suvorova et al., 2012, 2013; Dmitriev et al., 2017).
From a comparison of deep penetrations of electrons and protons, Zhao et al. (2017a) have revealed principal differences in these phenomena, suggesting different underlying physical mechanisms responsible for deep penetrations of protons and electrons. Particularly, deep proton penetration is consistent with convection of plasma sheet protons, and deep electron penetration suggests the existence of a local time localized mechanism. Moreover, Turner et al. (2015, 2017) showed that the deep injections of electrons at L<4 resulted from a different mechanism than injections observed at higher L shells. Particularly, Turner et al. (2015) hypothesized that the mechanism could be related to wave activity in the Pi2 frequency range, which usually serves as an indicator of substorm activity. Overall, dynamics of the tens to hundred keV electrons at low L shells is very different from dynamics of both protons and electrons at higher L shells and also in the higher energy range. The electron injections at L<3 cannot be explained by an enhanced convection electric field, convection of plasma sheet electrons or inward radial diffusion (e.g. Turner et al., 2017; Zhao et al., 2017a).
The ability of energetic electrons to penetrate deeply into the inner zone and below is still puzzling. An answer to the question may be found by investigating the relation of deep injections of energetic electrons to solar wind parameters, geomagnetic activity indices and other parameters of magnetospheric and ionospheric responses (Suvorova, 2017; Zhao et al., 2017b). Rapid enhancements of electron fluxes in the inner zone and below have been known for a long time in association with strong magnetic storms (e.g. Krasovskii et al., 1961; Savenko et al., 1962; Pfitzer and Winckler, 1968). However, increased statistics have revealed that deep injections of keV-energy electrons may occur frequently, and furthermore, regardless of storm strength (Tadokoro et al., 2007; Park et al., 2010; Zhao and Li, 2013; Suvorova et al., 2013, 2016).
The statistical study by Suvorova (2017) showed that electron injections into the forbidden zone (L<1.2) are relatively rare and occur mostly during magnetic storms and substorms. But sometimes, they also occur during non-storm conditions and weak substorm activity. This fact is consistent with the recent finding of “quiet” injections in the inner radiation belt mentioned above. A case of “quiet” injections of energetic electrons at L<1.2 is the focus of our study.
Here, we summarize the main characteristics of the electron injections into the very low L shells from several papers (Suvorova and Dmitriev, 2015; Suvorova, 2017; Dmitriev et al., 2017). The quasi-trapped energetic electron population in the forbidden zone, referred to as forbidden energetic electrons (FEE), can be characterized as transient with highly variable fluxes. The behaviour of FEE is similar to keV-energy trapped electrons in the inner radiation belt with flux enhancements in response to magnetic storms (e.g. Tadokoro et al., 2007; Dmitriev and Yeh, 2008; Zhao et al., 2017a). Simultaneous measurements of particles by satellites at different altitudes provided clear evidence that the forbidden zone enhancements of energetic electrons were caused by fast penetration of the inner belt electrons (Suvorova et al., 2014). As is known, an important role in fast transport of particles during storms is played by magnetic and electric field perturbations. Such perturbations are usually associated with the influence of magnetospheric substorms or nighttime processes of magnetic field dipolarizations in the magnetotail (e.g. Glocer et al., 2011). However, substorm signatures in the magnetic field in the low L region (L<2) have never been observed.
The most probable mechanism of the FEE injections was suggested to be the E×B drift (Suvorova et al., 2012), and most researchers consider and model an electric drift of inner belt electrons in the E×B fields, even though the electric field must be very high (e.g. Zhao and Li, 2013; Lejosne and Mozer, 2016; Selesnick et al., 2016; Su et al., 2016). According to simulation results of Selesnick et al. (2016), the electric field of ∼5 mV m−1 can provide deep injections at L<1.3. There is no explanation for penetration of a strong electric field to such low L shells. What is more important, there is no reliable information on electric fields at heights of 500–2000 km, because measurements there are difficult, and, as a consequence of this, empirical electric field models are limited and do not provide the results below L∼2 (e.g. Rowland and Wygant, 1998; Matsui et al., 2013). The most modern research suggests that the actual strength of penetration electric fields can be stronger than any existing electric field model at L<2 (Su et al., 2016).
A relation between the FEE injections and geomagnetic activity was studied in Suvorova et al. (2013, 2014). It seemed for a while that intense geomagnetic activity like auroral substorms was one of the necessary factors for deep electron injections, and the storm-time Dst variation did not control the FEE occurrences (Suvorova et al., 2014). It was suggested that substorm-associated strong electric fields can penetrate to the low L region, thereby creating the conditions for fast earthward transport of trapped electrons in crossed E and B fields. Note that recent modelling of the E×B transport mechanism at L<1.3 demonstrated that the mechanism can successfully operate in the low L region (Selesnick et al., 2016).
However, after that, many FEE events were found during moderate and weak auroral activity, which was typical for pre-storm (initial phase) or even non-storm conditions and, moreover, a high AE index does not always guarantee injections (Suvorova and Dmitriev, 2015). Indeed, statistically, such a casual relationship with substorms was not confirmed (Suvorova, 2017). From total statistics of ∼530 d with FEE enhancements collected during two solar cycles, more than three dozen days without essential substorm activity were found. These “quiet” events occurred over the past decade from 2006 to 2016. The FEE enhancements in that case were observed only in the low-energy range of tens of keV.
It is important to mention that one interesting feature was unexpectedly found from the statistical study. It is that the most favourable conditions for the FEE enhancements arise in the period from May to September independently of the geomagnetic activity level. A second, minor peak of the occurrence appears in the December–January period. Suvorova (2017) suggested an important role of the auroral ionosphere in the occurrence of FEE injections. The peculiar annual variation of the FEE occurrence rate was explained by a change in conductance of the auroral ionosphere. The conductance depends directly on the illumination of the noon sector of the auroral zone. A seasonal variation (summer–winter asymmetry) of dayside conductance was demonstrated by Sibeck et al. (1996). As is known, the high-latitude ionosphere is better illuminated during solstice periods, in that the illumination of the northern region is higher than the illumination of the southern one because of the dipole axis offset relative to the Earth's centre. This fact can explain the existence of two peaks of the FEE occurrence, with the major one during the northern summer period.
External drivers from the solar wind should trigger some processes in the magnetosphere–ionosphere system that might result in the electron injections into the forbidden zone. However, the external drivers are necessary but often not sufficient for FEE enhancements to occur. If the auroral ionosphere is sunlit, then the impact of external drivers more likely results in the electron injections into the forbidden zone. In this case, the factor of the dayside auroral ionosphere conductivity is sufficient, and it comes to the fore during weak geomagnetic activity. The relevant processes in the magnetosphere–ionosphere chain during magnetic quiet are still unclear. A comprehensive analysis of the solar wind drivers and magnetospheric response may help us to lift the veil. In this paper, we study prominent FEE enhancements during non-storm conditions on 1 August 2008 in order to determine their possible drivers in the solar wind. Note that this event is a subset (1 %) of the total statistics collected by Suvorova (2017) during various conditions, from magnetic quiet to extremely strong geomagnetic storms.
2.1 Forbidden electron enhancements
Figure 1 shows large enhancements of the >30 keV electron fluxes at low latitudes on 1 August 2008. The data were compiled from all orbital passes of five NOAA/POES satellites. The electron fluxes in the energy ranges >30, >100, and > 300 keV were measured by the MEPED instruments boarded on each satellite. The MEPED instrument includes two identical electron solid-state detector telescopes and measures particle fluxes in two directions: along and perpendicular to the local vertical direction (Evans and Greer, 2004). The data shown in Fig. 1 are from the 0∘ telescope oriented along the orbital radius vector (i.e. vertically), so that it measured quasi-trapped particles near the Equator and precipitating particles in the auroral region. The forbidden zone is defined as L<1.2 in the longitudinal range from 0 to 260∘ E (or 100∘ W) that is beyond the South Atlantic Anomaly (SAA). The drift L shells are calculated from the IGRF-2005 model. Figure 1a shows the observations of >30 keV electrons at 00:00–12:00 UT. At that time, the satellites passed the same regions, but they did not detect any FEE enhancements. Figure 1b shows the interval 12:00–24:00 UT, when fluxes of >30 keV quasi-trapped electrons in the forbidden zone increased by 3 orders of magnitude above a background of ∼102 (cm2 s sr)−1.
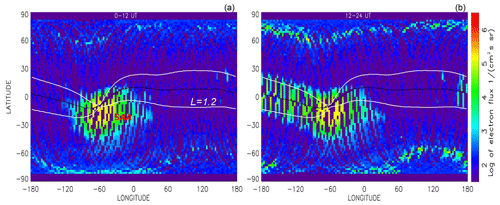
Figure 1Geographic distribution of >30 keV electron fluxes measured by five NOAA/POES satellites on 1 August 2008 for the time interval (a) 00:00–12:00 UT, before the electron flux enhancements, and (b) 12:00–24:00 UT, during the enhancements. The electrons are detected in the vertical direction. In the forbidden zone those electrons are quasi-trapped. The electron fluxes enhanced largely during non-storm conditions after 12:00 UT. The forbidden zone is bounded by L=1.2 (white lines) and located outside of the South Atlantic Anomaly (SAA) at equatorial to low latitudes. Drift L shells are calculated from the IGRF-2005 model. The solid black curve indicates the dip equator.
We have selected FEE enhancements with intensity >103 (cm2 s sr)−1. As found previously, the flux enhancements at low latitudes are peculiar to the quasi-trapped energetic electrons (Suvorova et al., 2012). In contrast, enhancements of electrons precipitating at low latitudes are very rare, weak and short. During the event, precipitating electron fluxes in the forbidden zone did not increase (not shown). Fluxes of the precipitating and quasi-trapped >100 keV electrons and >30 keV protons did not increase either (not shown). The quasi-trapped electrons are mirroring at heights below the satellite orbit (∼850 km) in a region of ±30∘ latitudes and drift eastward at a rate of 17–19∘ h−1 toward the SAA area, where they are lost due to scattering in the dense atmosphere.
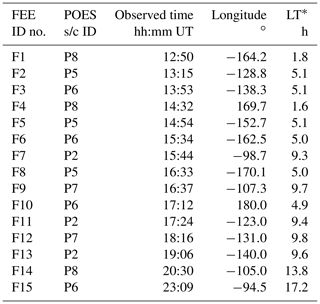
Figure 2 and Table 1 present the main characteristics of 15 FEE enhancements detected along equatorial passes of NOAA/POES satellites (P2 = MetOp2, P5 = NOAA-15, P6 = NOAA-16, P7 = NOAA-17, P8 = NOAA-18). The fluxes stayed at the enhanced level for several hours. We analyse the peak fluxes in the FEE enhancements (time, local time, longitude, and L shell). Positions of the satellite orbital planes provided a good coverage of the entire local time (LT) range: 9–21 LT (P2 and P7), 5–17 LT (P5 and P6), and 2–14 LT (P8). The coverage allows determination of the injection region with an uncertainty of approximately 2 h. The first FEE enhancement was observed at ∼ 12:50 UT in the central Pacific at night time (2 LT), and the last (enhancement number F15) was detected at ∼ 23:10 UT near the western edge of SAA at day time (17 LT). As seen in Fig. 2a, b, the FEE enhancements peak at minimal L shells, i.e. at the Equator. The fluxes decrease quickly with growing L. This pattern corresponds to a fast radial transport (injection) of electrons from the inner radiation belt. Note that pitch-angular scattering of electrons gives different profiles: the fluxes should be minimal at the Equator and grow with the L shell.
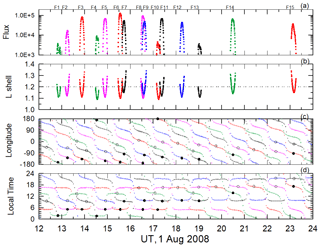
Figure 2FEE enhancements on 1 August 2008: (a) fluxes of >30 keV electrons in units (cm2 s sr)−1, (b) L shell of enhancements, (c) longitude, and (d) local time of peak fluxes (black circles). Measurements within the SAA area are indicated by the open circles. Colourful curves denote NOAA/POES satellites: P2 (black), P5 (pink), P6 (red), P7 (blue), and P8 (green). The horizontal dashed line in panel (b) depicts the lower edge of the inner radiation belt. FEE enhancements peak at the equator (minimal L shells), which indicates a fast radial transport from the inner radiation belt.
It was shown statistically that electron deep injections into the forbidden zone occur in the midnight–morning sector (Suvorova, 2017). During typical geomagnetic disturbances, nighttime FEE enhancements are observed shortly after local injections and near an injection site, while subsequent FEE enhancements at daytime are already the result of azimuthal drift of electrons injected at nighttime. Hence, the nighttime (∼2 LT) enhancements F1 and F4 of >30 keV electron fluxes indicate approximately the time of injection, respectively, at ∼ 12:50 and ∼ 14:30 UT or a little bit earlier. After 15:30 UT, enhancements were observed at daytime (numbers F7, F9, and F11–15) and are therefore associated with drifting electrons.
All remaining enhancements F2, F3, F5, F6, F8, and F10 of >30 keV electron fluxes were observed in the early morning (5 LT) for a long time interval of ∼4 h that led us to suspect that the enhancements were observed near the injection site. Nevertheless, we examine the assumption about drift by comparing these enhancements with the injection time for numbers 1 and 4 in Table 1. For enhancements F1 and F2, 30 keV electrons injected at 12:50 UT must drift ∼35.4∘ in longitude in order to reach the P5 observing satellite. It takes ∼112 min with the drift rate of 19∘ h−1 for 30 keV electrons at L∼1.2. However, the observed time difference between F1 and F2 is only 25 min, which is too short for drifting from the longitude of F1 to the longitude of F2. Enhancements F1 and F3 have the longitudinal difference of 26∘ for 1 h, which is much larger than the 19∘ produced by the drift of ∼30 keV electrons. In the case of higher energy electrons (e.g. ∼50 keV), the flux should have decreased notably due to a falling energy spectrum.
Likewise, one can infer that enhancement F4 also did not result in enhancements F5 and F6 and certainly not in enhancements F8 and F10. Therefore, the specific longitudinal and local time distributions of the enhancements indicate multiple injections during about 4.5 h in the sector of 0–6 LT, and the injection region was confined within 3 h of local time over the central and eastern Pacific. In general, these characteristics of injections are in good agreement with those found from the statistics (Suvorova, 2017).
2.2 Upstream solar wind conditions
An intriguing aspect of these FEE injection events is that they occurred under quiet, non-storm conditions, characterized by Dst/SYM-H ∼0 nT and AE < 100 nT (see Fig. 3). We examine solar wind parameters to search for drivers inducing such deep electron injections. We focus on a comparison between the solar wind parameters measured far upstream and near the bow shock and on their influence on the magnetospheric magnetic field during the period of interest. Global indices of geomagnetic activity and upstream solar wind from the OMNI database in GSM coordinates are shown in Fig. 3.
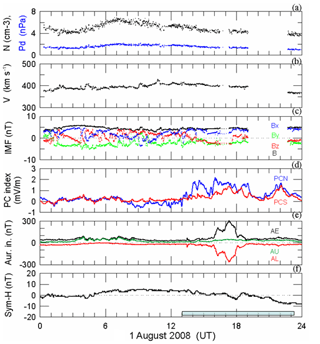
Figure 3Solar wind parameters from OMNI data and geomagnetic indices on 1 August 2008. From top to bottom: (a) solar wind density (black) and dynamic pressure (blue), (b) solar wind speed, (c) interplanetary magnetic field (IMF) components Bx (blue), By (green), Bz (red), and magnitude B (black) in geocentric solar magnetospheric (GMS) coordinates, (d) polar cap magnetic activity index PCN for the Northern Hemisphere (blue) and PCS for the Southern Hemisphere (red), (e) auroral electrojet index AE (black), AL (red), and AU (green), and (f) storm-time ring current variation index SYM-H. The shaded box denotes the time interval from 13:00 to 23:00 UT, when the non-storm FEE enhancements were observed.
As seen in Fig. 3, the solar wind speed and density smoothly varied around averages of 400 km s−1 and 6 to 4 cm−3, respectively, that resulted in a gradual change in the dynamic pressure Pd from 2 to 1 nPa. The interplanetary magnetic field (IMF) can be characterized as weakly disturbed by small-scale structures because of chaotic variations of the magnetic field components and discontinuities, particularly during the first half of the day. Also, in this period, the Bz component was predominately positive. Later, there was a short interval from 15:00 to 18:00 UT when IMF orientation was relatively steady with a continuous negative Bz of about −2 nT. The AL index increased between 16:00 and 18:00 UT with a peak of −250 nT. The 1 min SYM-H index was nT throughout the whole day, indicating there was no geomagnetic storm.
Overall, the OMNI magnetic and plasma parameters can be characterized as almost undisturbed in the period of the FEE enhancements from 12:00 to 23:00 UT. Obviously, the weak auroral activity at ∼ 17:00 UT could not result in extremely deep injections of the energetic electrons, which started much earlier, around 13:00 UT, whereas, looking at the PC index, which represents magnetic activity in the northern (PCN) and southern (PCS) polar caps (Troshichev et al., 1988), one can see a clear disturbance, particularly in the northern polar cap during that period.
As shown in Fig. 3, the polar cap PCN index started to increase after 13:00 UT under northward IMF. After 14:00 UT, the moderate polar cap activity (PCN ∼ 1.5–2 mV m−1) indicates intensification of the R1 field-aligned currents in the dawn and dusk magnetosphere (Troshichev et al., 2016). It should be noted that the weak and moderate PC-index activity can also be produced by changes in the solar wind dynamic pressure (Lukianova, 2003). Hence, the enhanced PCN during 13:00–16:00 UT might indicate the compressions of the dayside magnetosphere. However, from Fig. 3, it is difficult to identify appropriate solar wind drivers for interpretation of the polar cap activity at that time. From analysis of SuperMag magnetic data, we found that the magnetic variations dominated on the dayside, dawn, and partially dusk sectors from 13:00 to 17:00 UT (see Figs. S1 and S2 in the Supplement). Hence, the enhancement of the PCN index from 13:00 to 16:00 UT resulted rather from compressions of the dayside magnetosphere.
This raises the question of actual solar wind characteristics at the near-Earth location during the event. The FEE enhancement event under the non-storm condition and mild, ordinary solar wind properties presents an intriguing challenge to current understanding of the energetic particle injections, which usually are associated with intense substorm activity. From the characteristic PC-index behaviour, we suspect the actual solar wind parameters affecting the magnetosphere may be different from those predicted by OMNI. Fortunately, the near-Earth THEMIS mission can provide necessary reliable information on upstream conditions.
2.3 THEMIS foreshock observations
During the time interval from 12:00 to 18:00 UT, the THEMIS-C satellite (TH-C) moved from the subsolar region (17.2, −0.3, −5.9 RE GSM) toward dusk (18.1, 3.4, −5.9 RE GSM) (see Fig. 4). From the TH-C plasma and magnetic measurements (Fig. 5), we infer that the probe was located upstream of the bow shock, whose average subsolar position was estimated as ∼14.6 RE for Pd∼1.5 nPa (Fairfield, 1971). Figure 5a shows measurements of the THEMIS-C/FGM fluxgate magnetometer in GSM coordinates with a time resolution of ∼3 s (Auster et al., 2008) and the ion spectrograms from the THEMIS-C/ESA plasma instrument (McFadden et al., 2008). The ion spectrogram clearly demonstrates that hot ions (∼1 keV) are of solar wind origin and magnitudes of magnetic field components correspond to IMF components in Fig. 3. The magnetic field components measured in situ by TH-C are compared with those predicted by OMNI and shown in Fig. 5b. Also, Fig. 5c presents the IMF cone angles, between the IMF vector and the Earth–Sun line, for both magnetic data sets. In Fig. 5d, dynamic pressures for OMNI, ACE, and TH-C are compared.
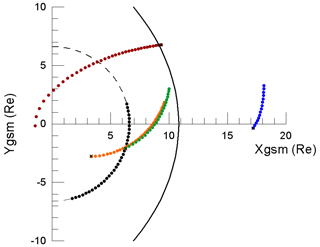
Figure 4Spacecraft positions in GSM coordinates from 12:00 to 18:00 UT on 1 August 2018. The TH-C probe (blue) was in front of the subsolar bow shock. The TH-E (orange), TH-D (green), TH-B (brown), and GOES 12 (black) were located inside the dayside magnetosphere. The magnetopause position (black curve) was calculated using OMNI data for the upstream conditions at ∼ 16:00 UT following the model by Lin et al. (2010).
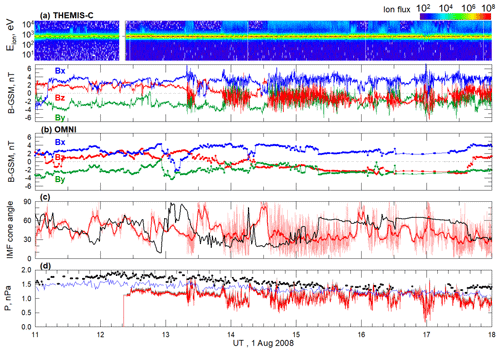
Figure 5Observations of the plasma and magnetic field on 1 August 2008. (a) Ion spectrogram (ion flux is in units of eV (cm2 s sr eV)−1) and IMF vector components in GSM coordinates measured by TH-C; (b) IMF vector components from the OMNI data set. Comparison of OMNI and TH-C data: (c) IMF cone angles plotted for OMNI (black) and TH-C (pink); the red curve shows the TH-C smoothed cone angle. (d) Solar wind dynamic pressure for OMNI (black circle), ACE (blue curve), and TH-C (red curve). The grey curve shows TH-C total pressure (sum of dynamic, magnetic, and thermal pressures). The ACE data are shifted by 60 min.
We evaluate characteristics of the upstream solar wind structures actually affecting the magnetosphere during the period of the FEE enhancements. From 11:00 to 13:20 UT, three TH-C magnetic components demonstrated small-amplitude variations, and the Bz component had a northward direction. During this time, there were discrepancies between magnetic components of the TH-C and OMNI data caused mostly by a time shift of ∼ 10–15 min, so that TH-C observed arrival of the solar wind structures at an earlier time than that predicted by OMNI. With time correction, one can achieve better consistency in the two magnetic data sets except the difference in the Bx components about 13:10 UT.
In Fig. 5c, the OMNI cone angle dropped below 30∘ between 13:30 and 15:20 UT, which corresponded to a quasi-radial IMF orientation (IMF is almost along the Earth–Sun line), whereas cone angle variations detected by TH-C were very different from the OMNI data. After 15:00 UT, the OMNI data do not match the TH-C observation any more, even with time correction. About ∼ 13:20, ∼ 14:00, and after 14:40 UT, the in situ observation of THEMIS shows large-amplitude fluctuations with durations of tens of minutes in three magnetic components and cone angle (Fig. 5a, c). The observed large magnetic fluctuations are ultra-low-frequency (ULF) waves, and they are a typical signature of the upstream region of quasi-parallel bow shocks, so-called foreshock (e.g. Schwartz and Burgess, 1991). In addition, in the same time intervals, the plasma spectrogram shows enhancements of suprathermal ion fluxes with an energy of >10 keV (upper panel in Fig. 5a). This is another distinguishing signature of the foreshock, known as diffuse ion population, which is always observed together with the upstream ULF waves (Gosling et al., 1978; Paschmann et al., 1979). Hence, the upstream foreshock waves and diffuse ions observed by TH-C in the subsolar region are associated distinctly with a radial or quasi-radial IMF orientation in the undisturbed solar wind. Note that the longest foreshock interval (14:35–15:50 UT) associated with the quasi-radial IMF orientation was observed ∼20 min later than that predicted by OMNI.
After 15:20 UT, the prediction and in situ data mismatch greatly. The TH-C satellite observed several IMF discontinuities and alternation between spiral and radial orientations of the IMF vector, while the OMNI magnetic field does not change the spiral orientation from 15:20 to 17:40 UT. The foreshock returned to the subsolar region periodically and more frequently in the interval 16:00–17:30 UT than in the earlier period 13:20–14:40 UT. This behaviour indicates the transient subsolar foreshock.
Note that these two time intervals of frequent foreshock transitions differ in the Bz component: Bz>0 at 13:20–14:40 UT and Bz<0 at 16:00–17:00 UT. It is natural that the southward Bz results in the weak auroral activity during the latter interval. Nevertheless, the changing direction of IMF has the effect on the magnetic activity in the northern polar cap during both intervals (see the PC index in Fig. 1).
Figure 5d demonstrates large differences in solar wind dynamic pressure acquired from the TH-C probe, the ACE upstream monitor, and OMNI data. The ACE data are shifted by 60 min. In contrast to OMNI and ACE, TH-C observed strong fast fluctuations in the dynamic pressure during intervals of subsolar foreshock (see Fig. 5c). Note that ACE shows on average a smaller pressure than OMNI predicts, and it is closer to the TH-C observations. The fluctuations in the TH-C measurements are characterized by pressure pulses, which exceed sometimes the dynamic pressure from ACE (e.g. at 13:20–13:30, 13:50, 14:20, 14:40, and 15:30). The pulses originated from plasma density enhancements because the plasma velocity remained practically constant at that time (not shown). A similar foreshock phenomenon was described by Fairfield et al. (1990). Apparently, the foreshock pressure pulses were further transported by the solar wind to the magnetosheath and could affect the magnetopause. Similar foreshock pressure pulses and their compression effects in the magnetosphere–ionosphere were reported by Korotova et al. (2011).
2.4 Magnetospheric magnetic field perturbations
We use magnetic field and plasma measurements in the magnetosphere from the other three THEMIS probes and GOES-12 and GOES-10 satellites in order to examine a magnetospheric response to the pressure pulses in the subsolar foreshock, which forms each time with the arrival or departure of magnetic flux tubes with quasi-radial IMF orientation. Positions of the TH-B, TH-D, TH-E, and GOES-12 satellites in the X−Y GSM plane for the period from 12:00 to 18:00 UT are shown in Fig. 4. We used the model of Lin et al. (2010) to calculate the magnetopause position. The OMNI data at 16:00 UT are used as input data for the model. The GOES-12 and GOES-10 satellites moved from morning to noon (7–13 and 8–14 LT, respectively). The TH-E and TH-D probes moved outward from pre-noon to post-noon, and the TH-B probe moved inward in the afternoon–dusk sectors.
Figure 6 shows variations of the Bz component measured by the TH-E, TH-D, and TH-B probes, the magnetic field strength at geosynchronous orbit (GOES-12, -10), the ion spectrogram from the TH-D satellite, and the SYM-H index from 11:00 to 18:00 UT. The THEMIS magnetic data were detrended using the Tsyganenko T04 geomagnetic field model (Tsyganenko and Sitnov, 2005) and IGRF-2005 model (see Fig. 6b). The IGRF model describes the Earth's main magnetic field and the T04 model represents magnetic fields from the magnetospheric currents.
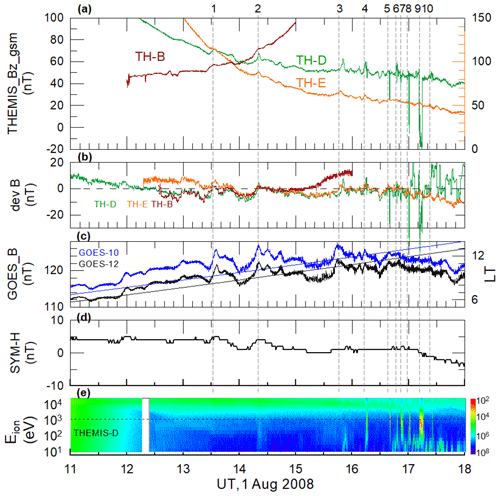
Figure 6Satellite measurements of magnetic fields and plasma in the dayside magnetosphere and geomagnetic activity. (a) The Bz GSM components from THEMIS probes TH-B (brown), TH-E (orange), and TH-D (green). The left y axis corresponds to the magnetic measurements from TH-B and TH-D, and the right y axis to TH-E. (b) The detrended magnetic fields for THEMIS. (c) The GOES-12 (black) and GOES-10 (blue) measurements of magnetic field strength (left y axis) and local time (right y axis). (d) The SYM-H index; and (e) the ion spectrogram from TH-D (ion flux is in units of eV cm−2 s sr eV). Dashed lines, numbered from 1 to 10, indicate magnetic and plasma disturbances observed by THEMIS.
As seen in Fig. 6a, e, characteristics of the magnetic field and hot plasma indicate that three THEMIS probes were located inside the dayside magnetosphere, a region of a strong magnetic field with the magnitude ranging from 40 to 150 nT and low density of hot (>10 keV) ions. Three THEMIS probes and GOES observed significant perturbations in the magnetic field with an increase/decrease of the order of several to tens of nT (Fig. 6a–c). After 16:00 UT, the largest (negative) amplitudes were observed by TH-D, which was mostly close to the magnetopause.
From 11:00 to 13:00 UT, one can see several increases of a few nT observed by GOES and/or THEMIS at ∼ 11:25, ∼ 12:00, ∼ 12:45, and ∼ 13:00 UT (Fig. 6b). From 13:00 to 15:00 UT, there are a few characteristic decreases and increases, with a duration of 20–30 min observed by all the probes. The magnetic field increases correspond to magnetospheric compressions, and the decreases are magnetospheric expansions (e.g. Dmitriev and Suvorova, 2012). Prominent magnetic “dimple–hump” structures are indicated by dashed lines (as 1, 2, and 3) and their peaks are listed in Table 2. We select peak-to-peak amplitudes exceeding ∼5 nT in the GOES data (Fig. 6c). The dimple–hump structures show the largest amplitudes up to 15 nT in the THEMIS data (Fig. 6b).
After 16:00 UT, the TH-D probe observed fast magnetic variations. At that time, the probe was approaching the magnetopause and moving ahead of the TH-E probe (see Fig. 4). Note that the fast magnetic fluctuations are not always seen in the SYM-H index because of a low time resolution (1 min). Figure 6e presents the ion spectrogram from TH-D. One can see several short-time intrusions of dense and cold plasma with spectra typical of the magnetosheath. Moreover, at ∼ 17:00 and 17:10 UT, the magnetospheric field measured by TH-D with positive Bz suddenly overturned to negative Bz for a moment that indicated a magnetosheath encounter. Time moments of peaks in the magnetosheath plasma pressure are indicated by lines 4–10 in Fig. 6 and listed in Table 2.
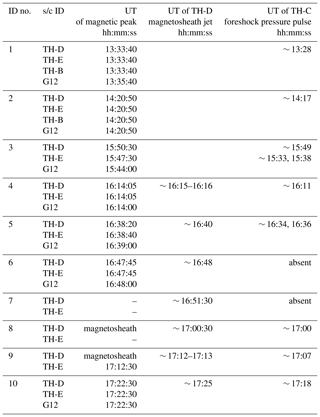
As seen in Fig. 6b–d, THEMIS magnetic observations correlate well with magnetic field variation observed by GOES-12 and GOES-10 in the whole interval. The time of some magnetic peaks coincides well, with an accuracy of 1 min (e.g. at ∼ 12:00, 13:00, and 14:20 UT), while others demonstrate various delays of 2–6 min between different satellites (see Table 2). In Table 2, we also list foreshock pulses related to the magnetic peaks observed in the magnetosphere (see Fig. 5d). Comparing the time moments of magnetic peaks and foreshock pressure pulses, we found that the latter often preceded the first ones by 1 min to a few minutes.
As we have found, the magnetic variations associated with expansion–compression effects could not be caused by the pristine solar wind pressure variations, which were gradual and small during the interval (see Figs. 3 and 5). The magnetic perturbations can be related to the foreshock pressure pulses. Unfortunately, THEMIS was not located in the magnetosheath from 12:00 to 16:00 UT, but an analysis of the later interval (16:00–18:00 UT) can provide important information about penetration of the foreshock pressure pulses through the magnetosheath.
2.5 Magnetosheath plasma jets interacting with the magnetopause
Figure 7 shows the magnetic field and plasma parameters observed by TH-D, TH-E, and TH-C during the interval 15:30–18:00 UT. In addition, magnetic measurements from GOES-12, the IMF cone angle from ACE and TH-C, and dynamic pressure from TH-C are shown. After 15:30 UT, the TH-D and TH-E probes observed magnetic field increases associated with the compression effect (Fig. 7d). After 16:00 UT, TH-D approached the magnetopause and started observing occasionally magnetosheath plasma in the magnetosphere, as seen in the ion spectrogram (e.g. lines 4–7 and 10, Fig. 7b). After 17:00 UT, the probe twice encountered the magnetosheath region as indicated by lines 8 and 9. The magnetosheath plasma can be recognized as a dense and cold (<1 keV) ion population.
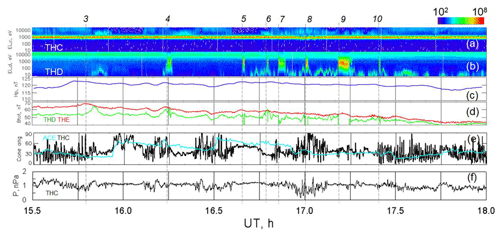
Figure 7Observations of the plasma and magnetic field at 15:30–18:00 UT on 1 August 2008: (a, b) ion spectrograms measured by TH-C, TH-D (ion flux is in units of eV cm−2 s sr eV), (c) horizontal magnetic field Hp detected by GOES-12 from 10 to 13 LT, (d) magnetic field strengths Btot from TH-D (green) and TH-E (red), and (e) IMF cone angles for TH-C (black) and the ACE upstream monitor (blue). (f) TH-C solar wind dynamic pressure. Dashed lines and numbers 4–10 mark plasma structures of magnetosheath ions observed inside the magnetosphere.
As seen in Fig. 7b and d, not all magnetic peaks are accompanied by plasma penetrations. During the interval, the outermost probe TH-C observed occasionally the foreshock phenomena, such as diffuse ions (≥10 keV), ULF waves, and pressure pulses (panels a, e, and f). As one can see, most of the magnetic peaks in panel d and/or magnetosheath ions in panel b were preceded by the foreshock pressure pulses within 1–5 min (panel f), for example at ∼ 15:49, ∼ 16:11, and ∼ 16:25 UT (see Table 2). There are exceptions for plasma penetrations 6 at 16:48 UT and 7 at 16:51:30 UT. Note that those events were preceded by IMF discontinuities as one can find in the rotation of the cone angle (panel e) at 16:45 and 16:50 UT, respectively.
Figure 8 shows characteristics of magnetosheath plasma in detail for three intervals 16:00–16:30, 16:30–17:00, and 16:58–17:28 UT. Since plasma charge neutrality means equal density of ions and electrons, Fig. 8 presents parameters of the ion component only (panels a–d). Total pressure (Ptot) and density (D) of the solar wind plasma measured far upstream by the ACE monitor are also shown for comparison in panels (b) and (c). The time period from 16:00 to 16:30 UT is shown in panels (a1)–(g1). The probes TH-D and TH-E observed magnetic field variation as a specific dimple–hump pattern from 16:09 to 16:15 UT (panels f1, g1), similar to the variations indicated by lines 1–3 in the earlier interval (see Fig. 6). This magnetic variation is preceded by the dimple–hump variation in the foreshock pressure as observed by TH-C at 16:07 to 16:11 UT (see Fig. 7f).
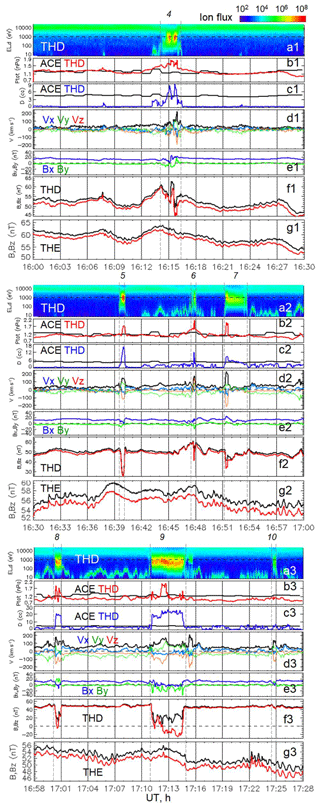
Figure 8Observations of the plasma and magnetic field during the intervals 16:00–16:30, 16:30–17:00, and 16:58–17:28 UT on 1 August 2008. The panels show from top to bottom: (a) ion spectrogram from TH-D, (b) total pressure Ptot measured by the ACE upstream monitor (black) and TH-D (red), (c) plasma density D measured by ACE (black) and TH-D (blue), (d) TH-D measurements of bulk velocity V (black) and its components in GSM coordinates Vx (blue), Vy (green), and Vz (red), (e) transversal components of magnetic fields Bx (blue) and By (green) from TH-D, (f) magnitude B and Bz components of the magnetic field from TH-D, and (g) magnitude B and Bz components of the magnetic field from TH-E. The magnetosheath plasma penetration is denoted by dashed lines and numbers 4–10.
The dimple–hump variations are followed by penetration of the magnetosheath ions into the magnetosphere as observed by TH-D at 16:14 to 16:16 UT (no. 4 in Table 2). At 16:14–16:16 UT, TH-D was located in the magnetosphere, but it observed cold ions (∼100 eV–3 keV) and electrons (<1 keV, not shown) of magnetosheath origin (Fig. 8, panel a1). The plasma has a maximal speed of >200 km s−1 and a high density of 3–9 cm−3 that result in the high total pressure of 1.5–1.8 nPa (panels b1–d1). Its dynamical characteristics distinctly exceed the solar wind parameters, with a density of 4–5 cm−3 and a total pressure of ∼1.1 nPa (panels b1, c1). The internal structure of the plasma forms three prominent pressure pulses between 16:14:50 and 16:16:00 UT; a central pulse is dominated by the magnetic component (panel f1) and two lateral pulses are dominated by dense plasma components (panel c1). Two plasma density enhancements produced a diamagnetic effect seen as a characteristic decrease in the magnetic field (panel f1). At the outer edge of the plasma structure, the anti-sunward velocity (Vx<0) reached a high value of −100 km s−1, indicating that the local plasma flow struck and interacted with the magnetopause (panel d1). The Vz component demonstrates a maximal value in the southward direction (−200 km s−1). Three rotated velocity components Vx, Vy, and Vz indicate that the vortex-like plasma structure propagated along the magnetopause toward south and dusk. This dense and high-speed plasma structure is analogous to the large-scale magnetosheath plasma jet studied by Dmitriev and Suvorova (2012). The jets are defined as intense localized fast ion fluxes whose kinetic energy density is several times higher than that in the upstream solar wind and whose duration is longer than 30 s (Dmitriev and Suvorova, 2015; Plaschke et al., 2018).
Panels (a2)–(g2) in Fig. 8 show magnetosheath plasma penetrations 5–7 during the time period from 16:30 to 17:00 UT. Plasma structures 5 and 6 (panel a2) have a short duration and are characterized by extremely high densities of 16 and 12 cm−3, respectively, that explain the compression effects in magnetic measurements from TH-E and TH-D well (panels f2, g2). Prolonged plasma structure 7 has a lower density of 4–9 cm−3 and did not produce a notable compression in accordance with TH-E magnetic measurements (panel g2). Note that structure 5 was preceded by a foreshock pulse observed at ∼ 16:37 UT, while there were no foreshock pulses before structures 6 and 7.
It is important that, inside each plasma structure, we reveal a dense plasma core, which is characterized by enhanced speeds of ∼150 or ∼220 km s−1 with a dominant Vz component (negative or positive). These parameters, typical of plasma jets, formed pressure of a high magnitude, which exceeded the upstream solar wind pressure by 50 %–80 % (panel b2). The magnetosheath plasma jets interacted with the magnetopause that resulted in penetration of the magnetosheath plasma into the magnetosphere (Dmitriev and Suvorova, 2015). The amount of penetrated plasma can be comparable with estimates of the total amount of plasma entering the dayside magnetosphere (Sibeck, 1999).
During the last period at 16:58–17:28 UT shown in panels (a3)–(g3), we have an excellent opportunity to examine plasma parameters in the magnetosheath region adjacent to the magnetopause. Panels (a3)–(f3) show two cases of magnetopause distortions followed by short intervals of the magnetosheath from ∼ 17:00 to 17:01 UT and from 17:11 to ∼ 17:15 UT. The TH-D probe at a distance of ∼10.8 RE and ∼13 LT suddenly crossed the magnetopause and moved into the magnetosheath, where Bz<0 (panel f3). Plasma in both magnetosheath intervals has extremely high density (∼20 cm−3) and high velocity (≤200 km s−1). In the magnetosheath, one can see local pressure pulses around ∼ 17:00 and ∼ 17:12 UT (lines 8 and 9). For case 9, TH-E observed a small shallow hump of the magnetic field of a few nT between two depletions at 17:07 and 17:15 UT (panel g3). The last event (no. 10) shown in Fig. 8c is a short penetration of magnetosheath plasma accompanied by a small perturbation in the magnetospheric field observed at ∼ 17:24–17:25 UT (panels e3, f3). The density and pressure of this structure did not exceed the solar wind parameters (panels b3–d3). Note that foreshock pressure pulses preceded by a few minutes the magnetic peaks and plasma structures 8, 9, and 10 as seen in Fig. 7.
Thus, we found typical characteristics of dense and fast plasma jets in all intrusions of the magnetosheath plasma into the magnetosphere and in the magnetosheath itself. Most of the penetrating magnetosheath jets correspond to the foreshock pressure pulses. All jet-related plasma structures caused local compression effects at the dayside. This finding raises further an interesting question about spatial distribution of geomagnetic field response to the impact of foreshock pressure pulses on the dayside magnetopause during very quiet geomagnetic conditions at 13:00–16:00 UT.
2.6 Global ground-based magnetic variations
The global dynamics of geomagnetic field perturbations was studied using 1 min magnetic data provided by an INTERMAGNET of ground magnetometers (http://www.intermagnet.org/index-eng.php, last access: 18 December 2019). We used magnetic stations located at geomagnetic latitudes below ∼60∘ (Table 3), where a significant effect of different propagation times of MHD waves in the magnetosphere was almost hidden at 1 min resolution. We grouped magnetic stations into meridional and latitudinal chains.
Table 3Locations of magnetic stations in geographic and geomagnetic coordinates.
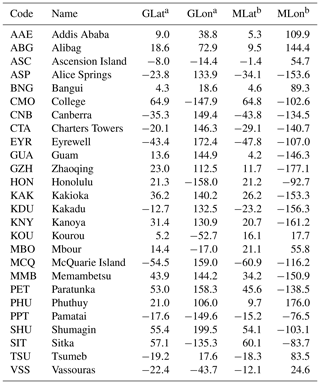
a Geographic latitude and longitude. b Magnetic latitude and longitude.
Figure 9 presents relative variations of the horizontal (H) component measured at equatorial and low geomagnetic latitudes (from 0 to ∼20∘) in the interval from 11:00 to 16:00 UT. The stations are arranged in local time from morning to post-midnight. The GOES-12 and detrended TH-D magnetic data are shown at the bottom. Four magnetic field pulses of different amplitudes are seen around ∼ 12:00, ∼ 13:35–13:45, ∼ 14:22–14:30, and ∼ 15:45–15:50 UT at practically all the stations. The last three pulses correspond to those selected from THEMIS data at ∼ 13:34, ∼ 14:21, and 15:47–15:50 UT (nos. 1–3; see also Table 2). Moreover, one can see the same pattern of magnetic variation “dimple–hump” in both ground-based and satellite observations. An earlier magnetic pulse of a smaller amplitude at ∼ 12:00 UT is also seen in the GOES-12 and TH-D data.
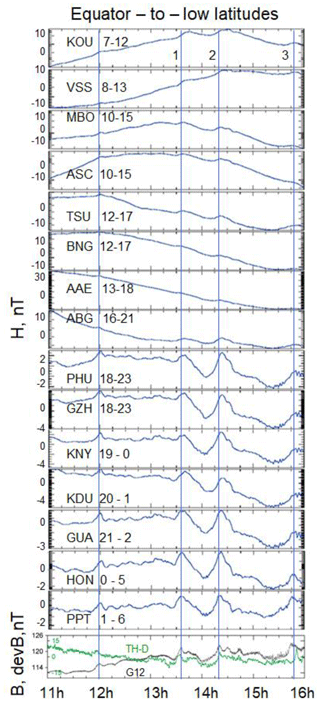
Figure 9Relative variations in the horizontal component (H) of the geomagnetic field at low geomagnetic latitudes. Local time intervals are indicated near the station codes. The vertical lines depict magnetic peaks 1–3 at THEMIS (see Table 2). The bottom panel shows magnetic field B measured by GOES-12 (black) and the detrended magnetic field from TH-D (green).
It is interesting that the magnetic pulse at 12:00 UT is simultaneously (within the accuracy of ∼1 min resolution) observed in all local time sectors. However, the other three enhancements were observed in different LT sectors at slightly different times. The time difference varies from ∼2 to ∼ 10 min. The time delay depends on the time moment when a jet interacts with the magnetopause in a given latitude–longitude sector (Dmitriev and Suvorova, 2012).
We draw attention to the fact that the low-latitude HON and PPT stations, which were located in the predawn sector (2–5 LT) from 13:00 to 15:00 UT, demonstrate the best coincidence (with a delay of ∼1 min) of magnetic peaks 1 and 2 with those observed by THEMIS near noon. Nighttime and daytime stations (PHU, GZH, KNY, KDU, GUA, MBO, ASC, TSU, BNG, AAE, ABG) observed these peaks with ∼ 3–5 min delay. The longest delay (∼7 min) for pulses 1 and 2 is found at morning/pr-enoon stations KOU and VSS (∼ 9–11 LT).
As we have shown above, the FEE injections (F1–F6 in Table 1) occur from ∼2 to 5 LT. So, we present meridional chains of stations in the predawn and midnight sectors (Fig. 10). All magnetic pulses are well recognized from 0 to 60∘ of geomagnetic latitude. In the midnight and predawn sectors, the magnetic pulse at ∼ 12:00 UT peaks practically simultaneously everywhere. Magnetic peak around ∼ 13:33 UT was delayed by ∼7 min at midlatitudes (30–60∘) in the midnight sector (left panel) and by ∼5 min in the predawn sector (right panel). Pulse 2 shows a smaller delay (∼3 min) at midlatitudes. Magnetic peak 3 at most stations in both sectors is observed around ∼ 15:45 UT, that is, 2 min earlier than at TH-E and 1 min later than at GOES (see Table 2).
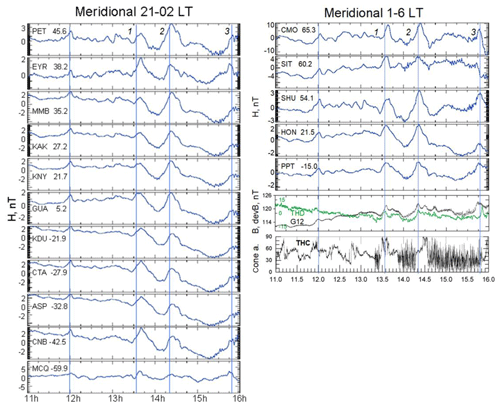
Figure 10Relative variations in the horizontal component (H) of the geomagnetic field in the midnight (left) and predawn (right) sectors. The geomagnetic latitudes of the stations are indicated near station codes. The vertical lines depict magnetic peaks at THEMIS (see Table 2). Magnetic data from the THEMIS and GOES satellites are shown in the lower panels on the right.
Thus, the ground-based magnetic observations at low and middle latitudes demonstrate similarity in the magnetic variations of the “dimple–hump” pattern to the satellite observations in the dayside magnetosphere. It should be noted that the magnetic peaks are not regular and are characterized by periodicities of tens of minutes that distinguish them from magnetospheric quasi-periodic ULF waves with periods of 1–600 s. Hence, the variations observed in the geomagnetic field should result from pressure pulses of the subsolar foreshock and/or magnetosheath origin.
In this work, using NOAA/POES and THEMIS satellites we investigated an unusual case of deep injections of >30 keV electrons at L<1.2 and corresponding upstream conditions during a quiet day on 1 August 2008. Strong FEE enhancements with intensities of up to ∼105 (cm2 s sr)−1 were observed by POES above the central and eastern Pacific for a long time from ∼ 13:00 to 23:00 UT. With analysis of longitudinal and local time distributions of the enhancements, we identified a series of nightside injections that occurred in the sector of 2–5 LT during the period from ∼ 13:00 to ∼ 17:00 UT (Fig. 2). We found that the first six injections (Table 1) occurred before intensification of auroral activity started at 16:00 UT, and, hence, cannot be related to the substorm. Two injections occurred during the interval of weak auroral activity at 16:00–18:00 UT.
It is important to note that the intensification of the AE index from 16:00 to 18:00 UT originated from magnetic activity at high latitudes on the dayside (see Fig. S2 in the Supplement). The dayside activity results from the multiple magnetospheric compressions (see Fig. 6). In this context, the substorm should rather be considered a “substorm-like” event related to compressions of the dayside magnetosphere.
We found that from 11:00 to 18:00 UT the magnetosphere was not completely quiet. Prominent magnetic variations on the dayside were observed by THEMIS and GOES satellites and by ground-based magnetometers from the INTERMAGNET network. The variations correspond to magnetospheric expansions and compressions. Comparative analysis of the THEMIS, OMNI, and ACE data showed that the geomagnetic perturbations were not driven by the dynamic pressure of the pristine solar wind. Note that significant discrepancies between the OMNI data and THEMIS near-Earth observations under a quasi-radial IMF were reported frequently (e.g. McPherron et al., 2013; Suvorova and Dmitriev, 2016). THEMIS observations show firmly that geomagnetic perturbations were rather related to changes in the IMF cone angle and pressure pulses in the subsolar foreshock.
We demonstrated that in the magnetosheath, foreshock pressure pulses could be transformed to fast and dense magnetosheath streams, so-called jets. We found that five out of seven magnetosheath jets were preceded by the foreshock pressure pulses. These results support well the previous findings that the plasma jets are a typical consequence of the foreshock dynamics and variations in the IMF orientation (e.g. Fairfield et al., 1990; Lin et al., 1996; Archer et al., 2012; Dmitriev and Suvorova, 2012, 2015; Plaschke et al., 2018). In addition, similar effects of the foreshock pressure pulses and magnetosheath jets in the magnetosphere were reported (e.g. Sibeck and Korotova, 1996; Korotova et al., 2011; Hietala et al., 2012).
In the present case, the amplitude of magnetic variations was not very high: from a few nT at the ground to 15 nT at THEMIS. It should be noted that such magnetic perturbations are too weak to produce deep injections of >30 keV electrons below the radiation belt. On the other hand, the interaction of jets with the magnetopause can also result in penetration of the magnetosheath plasma inside the dayside magnetosphere (Dmitriev and Suvorova et al., 2012, 2015). Precipitation of the hot magnetosheath and/or magnetospheric plasma into the dayside high-latitude ionosphere can cause intensification of dayside aurorae. Vorobjev et al. (2001) analysed dayside auroral transient events at latitudes equatorward of the auroral oval (below 76∘). They found that the dayside aurora brightening was related to localized magnetospheric compressions driven by abrupt changes in the foreshock (but not by variations in the pristine solar wind dynamic pressure). Recent comprehensive and statistical studies present observations of dayside aurora brightening related to localized magnetopause indentations (Han et al., 2018) and caused by magnetosheath high-speed jets (Wang et al., 2018). Additionally, Han et al. (2016) provided direct evidence that the source of precipitating particles in the dayside aurorae was the magnetosheath plasma (sometimes mixed with magnetospheric plasma). Thus, these studies showed that the jet impact is responsible for transient dayside aurora, which provides enhancements in the conductivity of the auroral ionosphere on the dayside.
In order to find signatures of particle precipitations at high latitudes, we conducted an additional analysis of hot plasma precipitations in the auroral region at L shells from 7 to 15 during the time of interest. The energy fluxes of hot plasma (from 50 eV to 10 keV) were measured by a POES/TED plasma spectrometer. Figure 11 demonstrates magnetic observations of THEMIS and GOES and POES observations of the energy fluxes of auroral precipitations and FEE injections. We consider intense precipitations with the threshold of 0.5 (erg cm−2 s−1), which is several times higher than the background. One can see that from 11:00 to 16:00 UT, the hot plasma precipitated mainly on the dayside (12–16 LT), while after 16:00 UT, the precipitations occurred practically at all local times on both the dayside and nightside.
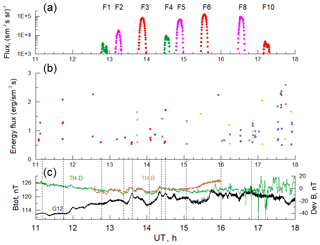
Figure 11Dynamics of the geomagnetic field and particles on 1 August 2008: (a) FEE enhancements, (b) plasma precipitation at high latitudes, and dayside magnetic field perturbations observed by (c) GOES-12 (black), TH-D (green), and TH-B (brown). The left y axis corresponds to GOES-12 and the right y axis to TH-D and TH-B. The numbers indicate the FEE injections at ∼2 and ∼5 LT (see Table 1); colours for the POES satellite are the same as in Fig. 2. Plasma precipitations are shown for the energy flux above the threshold of 0.5 (erg cm2 s)−1 and are grouped in LT: 23–24 LT (light grey), 0–2 LT (grey), 5–6 LT (blue), 12.5–15 LT (red points), 15–16 LT (violet), and 19.5–21.5 LT (green).
The first FEE injection (F1) at ∼ 12:50 UT was preceded by several geomagnetic pulses observed by GOES-12 and TH-D. The pulses were not very prominent because at that time, GOES-12 was located in the morning sector and TH-D was inside the geosynchronous orbit. One can see that some of the pulses were accompanied by dayside auroral precipitations of the hot plasma. Note that POES satellites have a 100 min orbital period and, hence, they can miss some of the localized precipitations. On the other hand, when a jet hits the magnetopause, the magnetosheath plasma does not necessarily penetrate into the dayside magnetosphere and, hence, does not precipitate at high latitudes (Dmitriev and Suvorova, 2015). Nevertheless, in Fig. 11, we find two cases of geomagnetic pulses followed by intense dayside precipitations of the hot plasma at 11:05 and 11:45 UT.
We can propose that the dayside precipitations at high latitudes are associated with the effect of jets piercing the magnetopause. The average flux of jet-related penetrating plasma was estimated as 3×10⁸ (cm2 s)−1 (Dmitriev and Suvorova, 2015). This particle flux corresponds well to the energy fluxes >0.5 erg cm−2 s−1 of precipitating ions with energy of ∼1 keV measured by POES/TED at high latitudes (see Fig. 11). Hence, the jet-related magnetosheath plasma can produce additional ionization and increase conductivity of the high-latitude ionosphere on the dayside.
At the same time, FEE enhancements were observed at low latitudes. It has been found that they result from an anomalous earthward radial E×B drift from the inner radiation belt (Suvorova et al., 2014, 2016; Selesnick et al., 2019). The drift should take a certain time dT to transport electrons from the inner radiation belt edge (at L shell L1=1.2) to the heights of ∼900 km (L shell L2 = 1.1–1.15):
where the E×B drift velocity is determined as
where L is the average L shell in the first approach and E is the azimuthal electric field in mV m−1. From Eqs. (1) and (2), we estimate that the earthward drift of energetic electrons across the magnetic field lines from L=1.2 to L=1.1 takes up to 40 min under the local electric field of ∼5 mV m−1. Note that E∼5 mV m−1 was obtained from simulations of energetic electron injections at L<1.3 (Selesnick et al., 2016, 2019).
In our case of non-storm conditions, it is hard to imagine that the strong azimuthal E can persist for such a long time. Previously, simulations by Su et al. (2016) have shown that it is not necessary for electrons to be transported earthward all the way during a single injection. Hence, we can consider a multi-step radial transport produced by a number of short pulses of E. In this case, the drift from L=1.2 to L=1.1 requires two or more pulses of ∼10 min duration that are comparable with the duration of jet-related disturbances. The multi-step process is limited by the time during which a particle stays in the region of injection. The >30 keV electrons have a long period of azimuthal drift (∼22 h) and, thus, they can stay in the region for hours. In contrast, the >100 keV electrons with the azimuthal period of ∼6 h leave the injection region quickly and, thus, do not have enough time to penetrate the forbidden zone. This effect can explain the absence of high-energy electrons in the FEE enhancements presented. In the case of electric field penetration from high to lower latitudes, the following effect might be important. At higher altitudes (larger L shells), the azimuthal drift periods of particles decrease dramatically. Hence, the particles escape quickly from the localized region with the enhanced electric field and, as a result, they drift earthward only a little.
In this scenario, the first FEE injection requires a long time (∼ hour and longer) and several pulses of E in order to transport energetic electrons from the undisturbed edge of the inner radiation belt to L∼1.1. Then, >30 keV electrons populate L shells from 1.15 to 1.1, which makes it possible to transport electrons to 900 km heights for a short time of ∼10 min by one pulse of strong E. The latter pattern is applicable for the FEE injection F2. As one can see in Fig. 11, each FEE injection after 13:00 UT is preceded within <30 min by intense auroral precipitations of the hot plasma.
It should be noted that most favourable conditions for FEE enhancements (and, presumably, for penetration of localized electric fields) arise in the period from May to September independently of geomagnetic activity level (Suvorova, 2017). Similar asymmetry in the dayside auroral conductivity was also shown by Sibeck et al. (1996). Our case event on 1 August 2008 corresponds well to these favourable conditions. Taking into account our previous finding that the occurrence of FEE enhancements is related to the ionization of the dayside ionosphere at high latitudes (e.g. Suvorova, 2017), the following scenario can be considered.
-
During quiet solar wind and geomagnetic conditions, the magnetosphere can be substantially disturbed due to transient subsolar foreshock under radial IMF.
-
Subsolar foreshock pressure pulses and IMF discontinuities result in generation of fast and dense plasma jets in the magnetosheath.
-
The jets' interaction with the dayside magnetopause produces two distinct features in the magnetosphere: geomagnetic pulses due to the compression and magnetosheath plasma penetration.
-
Precipitations of the magnetosheath plasma fluxes to the dayside high-latitude ionosphere should result in a local increase in the ionospheric conductivity and an enhancement of electric currents in the dayside ionosphere. The latter should induce transient localized electric fields on the nightside and especially in the post-midnight sector.
-
We hypothesize that the induced nightside electric field might penetrate from high to low latitudes (very low L shells) and produce earthward E×B drift of energetic electrons.
We should point out that the scenario suffers from some shortcomings. The energy flux of auroral precipitations of ∼ 1 erg (cm2 s)−1 was observed to be weak relative to that during substorms that results in a relatively weak additional ionization in the dayside ionosphere. It is hard to expect that the weak increase in the ionization can induce a strong electric field of E∼5 mV m−1. On the other hand, the satellite observations are sparse in space and time and, thus, a satellite might not catch an intense jet-related localized auroral precipitation of ∼10 min duration. Hence, the experimental information about auroral precipitations on the dayside is still incomplete.
Another serious problem is the generation/penetration of electric fields in the inner magnetosphere at low latitudes in the night sector, which is far from complete understanding. The convection electric field of up to 2 mV m−1 was observed at L>2 during disturbed geomagnetic conditions (Califf et al., 2014, 2017). During magnetic quiet, the convection electric field is apparently smaller (<0.5 mV m−1). On the other hand, a prompt penetrating electric field in the dayside ionosphere at heights ∼100 km was estimated of ∼ 2 mV m−1 (Huang, 2008). However, the electric field at heights from 1000 to 2000 km was not measured and, thus, its value is unknown. There are also no models predicting strong electric fields in the inner radiation belt and below. As conjugate observations of penetrating transient electric fields are still unavailable for such cases of anomalous particle transport, the exact mechanism of deep electron injections cannot as yet be fully determined.
Summarizing, from the experimental data available, the existing scenario cannot be firmly supported. It might also be that another unknown mechanism is responsible for the FEE enhancements during magnetic quiet periods. In this sense, further experimental studies and in situ observations of electric fields at L shells from 1.1 to 2 as well as of dayside auroral precipitations are required.
CDAWEB (https://cdaweb.gsfc.nasa.gov/index.html, NASA's Goddard Space Flight Center, 2019) provides the NOAA/POES energetic particle data, THEMIS magnetic and plasma data, OMNI and ACE solar wind data. The Kyoto World Data Center for Geomagnetism (http://wdc.kugi.kyoto-u.ac.jp/index.html, World Data Center for Geomagnetism, 2019) provides the geomagnetic indices. The ground magnetograms were collected from the INTERMAGNET network (https://www.intermagnet.org, Operations Committee of International Real-time Magnetic Observatory Network, 2019). SuperMag magnetic data were used in the Supplement (http://supermag.jhuapl.edu, SuperMag Steering Committee, 2019).
The supplement related to this article is available online at: https://doi.org/10.5194/angeo-37-1223-2019-supplement.
AVS, AVD and VAP processed and analyzed experimental data on energetic particles, magnetic fields and plasma. AVS found the event and designed the study. AVD developed the software for treatment of the satellite data. VAP analyzed ground-based magnetograms and contributed to discussion of results. AVS and AVD performed the whole analysis of the data, prepared figures and wrote the paper, as well as answered the referees during the evaluation process.
The authors declare that they have no conflict of interest.
We thank the THEMIS team for magnetic and plasma data provided. We thank the national institutes that support magnetic observatories from INTERMAGNET. We thank Oleg Troshichev for providing the PC index.
This research was supported by the MOST (Taiwan) (grant nos. 107-2811-M-008-1514, 108-2811-M-008-518, and 106-2111-M-008-030-MY3) to National Central University and partially supported by MOST (grant nos. 107-2111-M-008-011 and 107-2923-M-008-001-MY3/18-55-52006MHT_a).
This paper was edited by Wen Li and reviewed by four anonymous referees.
Archer, M. O., Horbury, T. S., and Eastwood, J. P.: Magnetosheath pressure pulses: Generation downstream of the bow shock from solar wind discontinuities, J. Geophys. Res., 117, A05228, https://doi.org/10.1029/2011JA017468, 2012.
Asikainen, T. and Mursula, K.: Filling the South Atlantic anomaly by energetic electrons during a great magnetic storm, Geophys. Res. Lett., 32, L16102, https://doi.org/10.1029/2005GL023634, 2005.
Auster, H. U., Glassmeier, K. H., Magnes W., Aydogar, O., Baumjohann, W., Constantinescu, D., Fischer, D., Fornacon, K. H., Georgescu, E., Harvey, P., Hillenmaier, O., Kroth, R., Ludlam, M., Narita, Y., Nakamura, R., Okrafka, K., Plaschke, F., Richter, I., Schwarzl, H., Stoll, B., Valavanoglou, A., and Wiedemann, M.: The THEMIS fluxgate magnetometer, Space Sci. Rev., 141, 235–264, https://doi.org/10.1007/s11214-008-9365-9, 2008.
Califf, S., Li, X., Blum, L., Jaynes, A., Schiller, Q., Zhao, H., Malaspina, D., Hartinger, M., Wolf, R. A., Rowland, D. E., Wygant, J. R., and Bonnell, J. W.: THEMIS measurements of quasi-static electric fields in the inner magnetosphere, J. Geophys. Res.-Space, 119, 9939–9951, https://doi.org/10.1002/2014JA020360, 2014.
Califf, S., Li, X., Zhao, H., Kellerman, A., Sarris, T. E., Jaynes, A., and Malaspina, D. M.: The role of the convection electric field in filling the slot region between the inner and outer radiation belts, J. Geophys. Res.-Space, 122, 2051–2068, https://doi.org/10.1002/2016JA023657, 2017.
Dmitriev, A. V. and Suvorova, A. V.: Traveling magnetopause distortion related to a large-scale magnetosheath plasma jet: THEMIS and ground-based observations, J. Geophys. Res., 117, A08217, https://doi.org/10.1029/2011JA016861, 2012.
Dmitriev, A. V. and Suvorova, A. V.: Large-scale jets in the magnetosheath and plasma penetration across the magnetopause: THEMIS observations, J. Geophys. Res.-Space, 120, 4423–4437, https://doi.org/10.1002/2014JA020953, 2015.
Dmitriev, A. and Yeh, H.-C.: Storm-time ionization enhancements at the topside low-latitude ionosphere, Ann. Geophys., 26, 867–876, https://doi.org/10.5194/angeo-26-867-2008, 2008.
Dmitriev, A. V., Suvorova, A. V., Klimenko, M. V., Klimenko, V. V., Ratovsky, K. G., Rakhmatulin, R. A., and Parkhomov, V. A.: Predictable and unpredictable ionospheric disturbances during St. Patrick's Day magnetic storms of 2013 and 2015 and on 8–9 March 2008, J. Geophys. Res.-Space, 122, 2398–2432, https://doi.org/10.1002/2016JA023260, 2017.
Glocer, A., Fok, M.-C., Nagai, T., Tóth, G., Guild, T., and Blake, J.: Rapid rebuilding of the outer radiation belt, J. Geophys. Res., 116, A09213, https://doi.org/10.1029/2011JA016516, 2011.
Gosling, J. T., Asbridge, J. R., Bame, S. J., Paschmann, G., and Sckopke, N.: Observations of two distinct populations of bow shock ions in the upstream solar wind, J. Geophys. Res., 5, 957–960, 1978.
Evans, D. S. and Greer, M. S.: Polar Orbiting Environmental Satellite Space Environment Monitor: 2. Instrument descriptions and archive data documentation. Tech. Memo. version 1.4, NOAA Space Environ. Lab., Boulder, Colo., 2004.
Fairfield, D.: Average and unusual locations of the Earth's magnetopause and bow shock, J. Geophys. Res., 76, 6700–6716, 1971.
Fairfield, D. H., Baumjohann, W., Paschmann, G., Luehr, H., and Sibeck, D. G.: Upstream pressure variations associated with the bow shock and their effects on the magnetosphere, J. Geophys. Res., 78, 3731–3744, 1990.
Han, D.-S., Nishimura, Y., Lyons, L. R., Hu, H. Q., and Yang, H. G.: Throat aurora: The ionospheric signature of magnetosheath particles penetrating into the magnetosphere, Geophys. Res. Lett., 43, 1819–1827, https://doi.org/10.1002/2016GL068181, 2016.
Han, D.-S., Liu, J.-J., Chen, X.-C., Xu, T., Li, B., Hu, Z.-J., Hu, H. Q., Yang, H. G., Fuselier, S. A., and Pollock, C. J.: Direct evidence for throat aurora being the ionospheric signature of magnetopause transient and reflecting localized magnetopause indentations, J. Geophys. Res.-Space, 123, 2658–2667, https://doi.org/10.1002/2017JA024945, 2018.
Hietala, H., Partamies, N., Laitinen, T. V., Clausen, L. B. N., Facskó, G., Vaivads, A., Koskinen, H. E. J., Dandouras, I., Rème, H., and Lucek, E. A.: Supermagnetosonic subsolar magnetosheath jets and their effects: from the solar wind to the ionospheric convection, Ann. Geophys., 30, 33–48, https://doi.org/10.5194/angeo-30-33-2012, 2012.
Huang, C.-S.: Continuous penetration of the interplanetary electric field to the equatorial ionosphere over eight hours during intense geomagnetic storms, J. Geophys. Res., 113, A11305, https://doi.org/10.1029/2008JA013588, 2008.
Korotova, G. I., Sibeck, D. G., Weatherwax, A., Angelopoulos, V., and Styazhkin, V.: THEMIS observations of a transient event at the magnetopause, J. Geophys. Res., 116, A07224, https://doi.org/10.1029/2011JA016606, 2011.
Krasovskii, V. I., Shklovski, I. S., Galperin, Y. I., Svetlitskii, E. M., Kushnir, Y. M., and Bordovskii, G. A.: The detection of electrons with energies of approximately 10 keV in the upper atmosphere, Iskusstvennye Sputniki Zemli, 6, 113–126, 1961 (in Russian, English translation: Planet. Space Sci., 9, 27-40, 1962).
Lejosne, S. and Mozer, F. S.: Typical values of the electric drift in the inner radiation belt and slot region as determined from Van Allen Probe measurements, J. Geophys. Res.-Space, 121, 12014–12024, https://doi.org/10.1002/2016JA023613, 2016.
Lin, R. L., Zhang, X. X., Liu, S. Q., Wang, Y. L., and Gong, J. C.: A three-dimensional asymmetric magnetopause model, J. Geophys. Res., 115, A04207, https://doi.org/10.1029/2009JA014235, 2010.
Lin, Y., Lee, L. C., and Yan, M.: Generation of dynamic pressure pulses downstream of the bow shock by variations in the interplanetary magnetic field orientation, J. Geophys. Res., 101, 479–493, 1996.
Lukianova, R.: Magnetospheric response to sudden changes in solar wind dynamic pressure inferred from polar cap index, J. Geophys. Res., 106, 1428, https://doi.org/10.1029/2002JA009790, 2003.
Matsui, H., Torbert, R. B., Spence, H. E., Khotyaintsev, Y. V., and Lindqvist, P.-A.: Revision of empirical electric field modeling in the inner magnetosphere using Cluster data, J. Geophys. Res.-Space, 118, 4119–4134, https://doi.org/10.1002/jgra.50373, 2013.
McFadden, J. P., Carlson, C. W., Larson, D., Ludlam, M., Abiad, R., Elliott, B., Turin, P., Marckwordt, M., and Angelopoulos, V.: The THEMIS ESA plasma instrument and in-flight calibration, Space Sci. Rev., 141, 277–302, https://doi.org/10.1007/s11214-008-9440-2, 2008.
McPherron, R. L., Baker, D. N., Pulkkinen, T. I, Hsu, T. S., Kissinger, J., and Chu, X.: Changes in solar wind–magnetosphere coupling with solar cycle, season, and time relative to stream interface, J. Atmos. Sol.-Terr. Phy., 99, 1–13, https://doi.org/10.1016/j.jastp.2012.09.003, 2013.
NASA's Goddard Space Flight Center: Space Physics Data Facility, available at: https://cdaweb.gsfc.nasa.gov/index.html, last access: 19 December 2019.
Operations Committee of International Real-time Magnetic Observatory Network: Data-Plotting Service, available at: https://www.intermagnet.org, last access: 19 December 2019.
Park, J., Min, K. W., Summers, D., Hwang, J., Kim, H. J., Horne, R. B., Kirsch, P., Yumoto, K., Uozumi, T., Lühr, H., and Green, J.: Non-stormtime injection of energetic particles into the slot region between Earth's inner and outer electron radiation belts as observed by STSAT-1 and NOAA-POES, Geophys. Res. Lett., 37, L16102, https://doi.org/10.1029/2010GL043989, 2010.
Paschmann, G., Sckopke, N., Bame, N., Gosling, J. T., Russell, C. T., and Greenstadt, E. W.: Association of low-frequancy waves with suprathermal ions in the upstream solar wind, Geophys. Res. Lett., 6, 209–212, 1979.
Pfitzer, K. A. and Winckler, J. R.: Experimental observation of a large addition to the electron inner radiation belt after a solar flare event, J. Geophys. Res., 73, 5792–5797, 1968.
Plaschke, F., Hietala, H., Archer, M., Blanco-Cano, X., Kajdič, P., Karlsson, T., Lee, S.-H., Omidi, N., Palmroth, M., Roytershteyn, V., Schmid, D., Sergeev,V., and Sibeck, D.: Jets downstream of collisioness shocks, Space Sci. Rev., 214, 81, https://doi.org/10.1007/s11214-018-0516-3, 2018.
Rowland, D. E. and Wygant, J. R.: Dependence of the large-scale, inner magnetospheric electric field on geomagnetic activity, J. Geophys. Res., 103, 14959–14964, 1998.
Savenko, I. A., Shavrin, P. I., and Pisarenko, N. F.: Soft particle radiation at an altitude of 320 km in the latitudes near the equator, Iskusstvennye Sputniki Zemli, 13, 75–80, 1962 (in Russian, English translation: Planet. Space Sci., 11, 431–436, 1963).
Schwartz, S. J. and Burgess, D.: Quasi-parallel shocks: A patchwork of three-dimensional structures, Geophys. Res. Lett., 18, 373–376, 1991.
Selesnick, R. S., Su, Y.-J., and Blake, J. B.: Control of the innermost electron radiation belt by large-scale electric fields, J. Geophys. Res.-Space, 121, 8417–8427, https://doi.org/10.1002/2016JA022973, 2016.
Selesnick, R. S., Su, Y.-J., and Sauvaud, J.-A.: Energetic electrons below the inner radiation belt, J. Geophys. Res.-Space, 124, 5421–5440, https://doi.org/10.1029/2019JA026718, 2019.
Sibeck, D. G.: Plasma transfer processes at the magnetopause, Space Sci. Rev., 88, 207–283, https://doi.org/10.1023/a:1005255801425, 1999.
Sibeck, D. G. and Korotova, G. I.: Occurrence patterns for transient magnetic field signatures at high latitudes, J. Geophys. Res., 101, 13413–13428, 1996.
Sibeck, D., Greenwald, R. A., Bristow, W. A., and Korotova, G. I.: Concerning possible effects of ionospheric conductivity upon the occurrence patterns of impulsive events in high-latitude ground magnetograms, J. Geophys. Res., 101, 13407–13412, https://doi.org/10.1029/96JA00072, 1996.
Su, Y.-J., Selesnick, R. S., and Blake J. B.: Formation of the inner electron radiation belt by enhanced large-scale electric fields, J. Geophys. Res.-Space, 121, 8508–8522, https://doi.org/10.1002/2016JA022881, 2016.
SuperMag Steering Committee: Polar Plots, available at: http://supermag.jhuapl.edu, last access: 19 December 2019.
Suvorova, A. V.: Flux enhancements of >30 keV electrons at low drift shells L<1.2 during last solar cycles, J. Geophys Res.-Space, 122, 12274–12287, https://doi.org/10.1002/2017JA024556, 2017.
Suvorova, A. V. and Dmitriev, A. V.: Radiation aspects of geomagnetic storm impact below the radiation belt, in: Cyclonic and Geomagnetic Storms: Predicting Factors, Formation and Environmental Impacts, edited by: Banks, V. P., 19–75, NOVA Science Publishers, Inc., New York, 2015.
Suvorova, A. V. and Dmitriev, A. V.: On magnetopause inflation under radial IMF, Adv. Space Res., 58, 249–256, 2016.
Suvorova, A. V., Dmitriev, A. V., and Tsai, L.-C.: On relation between mid-latitude ionospheric ionization and quasi-trapped energetic electrons during 15 December 2006 magnetic storm, Planet. Space Sci., 60, 363–369, https://doi.org/10.1016/j.pss.2011.11.001, 2012.
Suvorova, A. V., Dmitriev, A. V., Tsai, L.-C., Kunitsyn, V. E., Andreeva, E. S., Nesterov, I. A., and Lazutin, L. L.: TEC evidence for near-equatorial energy deposition by 30 keV electrons in the topside ionosphere, J. Geophys. Res., 118, 4672–4695, https://doi.org/10.1002/jgra.50439, 2013.
Suvorova, A. V., Huang, C.-M., Matsumoto, H., Dmitriev, A. V., Kunitsyn, V. E., Andreeva, E. S., Nesterov, I. A., and Tsai, L.-C.: Low-latitude ionospheric effects of energetic electrons during a recurrent magnetic storm, J. Geophys. Res.-Space, 119, 9283–9303, https://doi.org/10.1002/2014JA020349, 2014.
Suvorova, A. V., Huang, C.-M., Dmitriev, A. V., Kunitsyn, V. E., Andreeva, E. S., Nesterov, I. A., Klimenko, M. V., Klimenko, V. V., and Tumanova, Y. S.: Effects of ionizing energetic electrons and plasma transport in the ionosphere during the initial phase of the December 2006 magnetic storm, J. Geophys Res.-Space, 121, 5880–5896, https://doi.org/10.1002/2016JA022622, 2016.
Tadokoro, H., Tsuchiya, F., Miyoshi, Y., Misawa, H., Morioka, A., and Evans, D. S.: Electron flux enhancement in the inner radiation belt during moderate magnetic storms, Ann. Geophys., 25, 1359–1364, https://doi.org/10.5194/angeo-25-1359-2007, 2007.
Tsyganenko, N. A. and Sitnov, M. I.: Modeling the dynamics of the inner magnetosphere during strong geomagnetic storms, J. Geophys. Res., 110, A03208, https://doi.org/10.1029/2004JA010798, 2005.
Troshichev, O. A., Andrezen, V. G., Vennerstrøm, S., and Friis-Christensen, E.: Magnetic activity in the polar cap – A new index, Planet. Space Sci., 36, 1095–1102, 1988.
Troshichev, O., Sormakov, D., and Behlke, R.: Relationship between Pc Index, and Magnetospheric Field-Aligned Currents Measured by Swarm Satellites, J. Space Explor., 5, 107, 2016.
Turner, D. L., Claudepierre, S. G., Fennell, J. F., O'Brien, T. P., Blake, J. B., Lemon, C., Gkioulidou, M., Takahashi, K., Reeves, G. D., Thaller, S., Breneman, A., Wygant, J. R., Li, W., Runov, A., and Angelopoulos, V.: Energetic electron injections deep into the inner magnetosphere associated with substorm activity, Geophys. Res. Lett., 42, 2079–2087, https://doi.org/10.1002/2015GL063225, 2015.
Turner, D. L., O'Brien, T. P., Fennell, J. F., Claudepierre, S. G., Blake, J. B., Jaynes, A. N., Baker, D. N., Kanekal, S., Gkioulidou, M., Henderson, M. G., and Reeves, G. D.: Investigating the source of near-relativistics and relativistics electrons in Earth's inner radiation belt, J. Geophys. Res.-Space, 122, 695–710, https://doi.org/10.1002/2016JA023600, 2017.
Vorobjev, V. G., Yagodkina, O. I., Sibeck, D. G., Liou, K., and Meng, C.-I.: Polar UVI observations of dayside auroral transient events, J. Geophys. Res., 106, 28897–28911, https://doi.org/10.1029/2000JA000396, 2001.
World Data Center for Geomagnetism, Kyoto: Geomagnetic Data Service, available at: http://wdc.kugi.kyoto-u.ac.jp/index.html, last access: 19 December 2019.
Zhao, H. and Li, X.: Modeling energetic electron penetration into the slot region and inner radiation belt, J. Geophys. Res.-Space, 118, 6936–6945, https://doi.org/10.1002/2013JA019240, 2013.
Zhao, H., Baker, D. N., Califf, S., Li, X., Jaynes, A. N., Leonard, T., Kanekal, S. G., Blake, J. B., Fennell, J. F., Claudepierre, S. G., Turner, D. L., Reeves, G. D., and Spence, H. E.: Van Allen Probes measurements of energetic particle deep penetration into the low L region (L<4) during the storm on 8 April 2016, J. Geophys. Res., 122, 12140–12152, https://doi.org/10.1002/2017JA024558, 2017a.
Zhao, H., Baker, D. N., Jaynes, A. N., Li, X., Elkington, S. R., Kanekal, S. G., Spence, H. E., Boyd, A. J., Huang, C.-L., and Forsyth, C.: On the relation between radiation belt electrons and solar wind parameters/geomagnetic indices: Dependence on the first adiabatic invariant and L*, J. Geophys. Res.-Space, 122, 1624–1642, https://doi.org/10.1002/2016JA023658, 2017b.
Wang, B., Nishimura, Y., Heitala, H., Lyons, L., Angelopoulos, V., Plaschke, F., Ebihara, Y., and Weatherwax, A.: Impacts of magnetosheath high-speed jets on the magnetosphere and ionosphere measured by optical imaging and satellite observations, J. Geophys. Res.-Space, 123, 4879–4894, https://doi.org/10.1029/2017JA024954, 2018.


