the Creative Commons Attribution 4.0 License.
the Creative Commons Attribution 4.0 License.
Evidence of L-mode electromagnetic wave pumping of ionospheric plasma near geomagnetic zenith
H. Gordon James
Björn Gustavsson
Michael T. Rietveld
The response of ionospheric plasma to pumping by powerful HF (high frequency) electromagnetic waves transmitted from the ground into the ionosphere is the strongest in the direction of geomagnetic zenith. We present experimental results from transmitting a left-handed circularly polarized HF beam from the EISCAT (European Incoherent SCATter association) Heating facility in magnetic zenith. The CASSIOPE (CAScade, Smallsat and IOnospheric Polar Explorer) spacecraft in the topside ionosphere above the F-region density peak detected transionospheric pump radiation, although the pump frequency was below the maximum ionospheric plasma frequency. The pump wave is deduced to arrive at CASSIOPE through L-mode propagation and associated double (O to Z, Z to O) conversion in pump-induced radio windows. L-mode propagation allows the pump wave to reach higher plasma densities and higher ionospheric altitudes than O-mode propagation so that a pump wave in the L-mode can facilitate excitation of upper hybrid phenomena localized in density depletions in a larger altitude range. L-mode propagation is therefore suggested to be important in explaining the magnetic zenith effect.
Keywords. Space plasma physics (active perturbation experiments)
- Article
(881 KB) - Full-text XML
- BibTeX
- EndNote
Electromagnetic high-frequency (HF) pumping of ionospheric plasma from ground-based transmitters yields the strongest plasma response when the HF beam is directed in magnetic zenith, antiparallel to the geomagnetic field (B0) in the Northern Hemisphere. This magnetic zenith effect has been observed in several plasma phenomena. Experiments with the high-latitude EISCAT (European Incoherent SCATter association) high-power HF facility (named Heating) in northern Norway and the HAARP (High frequency Active Auroral Research Program) HF facility in Alaska, USA, show intensified optical emissions (Kosch et al., 2000; Pedersen and Carlson, 2001; Rietveld et al., 2003) and self-focusing (Gustavsson et al., 2001; Kosch et al., 2007) in magnetic zenith. Further, electron temperature enhancements are the largest when pumping near magnetic zenith (Rietveld et al., 2003; Honary et al., 2011) and pump-excited geomagnetic field-aligned density striations give the strongest HF-radar backscatter, as observed in experiments with EISCAT Heating (Rietveld et al., 2003; Blagoveshchenskaya et al., 2006), and the mid-latitude Sura HF facility in Russia (Tereshchenko et al., 2004). The question is, what causes the strong plasma response in magnetic zenith?
We present experimental results from EISCAT Heating (Rietveld et al., 2016); this HF facility was used to pump the plasma with left-hand circularly polarized (LHCP) HF radio waves. Here “left-hand” is defined from the point of view of B0: the wave electric field rotates in the opposite sense to the electron gyromotion. The HF beam was directed in magnetic zenith at 12∘ from vertical to the south and the pump frequency (f0) was chosen to be a few 100 kHz below the maximum electron plasma frequency of the F2 region (O-mode critical frequency, foF2) in the overhead daytime ionosphere. The plasma response to the HF pumping was observed with the EISCAT UHF (ultra high frequency) incoherent scatter radar at the Ramfjordmoen site.
The polar-orbiting CASSIOPE (CAScade, Smallsat and IOnospheric Polar Explorer) satellite in the topside ionosphere (perigee 325 × apogee 1500 km altitude, 80∘ inclination) was used to detect pump radiation above the F-region peak. The electromagnetic radiation was observed with the RRI (Radio Receiver Instrument) in the e-POP (enhanced Polar Outflow Probe) package on the fixed platform of CASSIOPE (James et al., 2015; Yau and James, 2015). The RRI is equipped with four monopole antennas, configured into two 6 m crossed dipoles, d1 and d2, that provide voltage magnitudes (V1, V2) and phases (Φ1, Φ2) of the detected signals. In some cases the detected signals enabled determination of the direction of arrival (DOA) of the incoming wave (James, 2017).
It is commonly assumed that a LHCP wave transmitted near-vertically from the ground propagates in the O-mode when entering the ionosphere. An O-mode wave propagating near-vertically reflects at the plasma resonance height, where the local plasma frequency fp=f0. However, our experimental results show that the pump wave passed through the ionospheric density peak although f0<foF2. This suggests that the pump wave transmitted near magnetic zenith propagated instead in the L-mode, which is a LHCP mode that has the wave vector parallel or antiparallel to the ambient magnetic field. A wave in the L-mode can propagate both on the O-mode dispersion surface and the Z-mode surface (also referred to as the slow extraordinary mode), and propagates from one surface to the other without linear conversion, always with the wave vector parallel to the ambient magnetic field. The square of the refractive index for the L-mode as obtained from the dispersion equation for a cold magnetized and homogeneous plasma is given by , where f is the wave frequency and fe is the electron gyrofrequency (Stix, 1992). Based on ray tracing analyses, it has been proposed that the pump wave can be guided in the L-mode by pump-induced kilometre-scale geomagnetic field-aligned plasma density ducts (Leyser and Nordblad, 2009; Nordblad and Leyser, 2010).
In November 2015, EISCAT Heating was used to transmit a LHCP pump wave continuously for several minutes during CASSIOPE passages approximately through the extension of the Heating beam in the topside ionosphere. A total of six conjunctions occurred during daytime, out of which two had the desired conditions of sufficiently low ionospheric absorption and , where the latter frequency corresponds to the L-mode cutoff (). The EISCAT UHF radar beam was scanned in steps of 1∘ every 10 s between eight elevations around magnetic zenith in the plane containing the vertical to measure background plasma parameter values.
On 12 November, f0=3.900 MHz and the pump wave was transmitted continuously between 14:00:05 and 14:15:00 UT with an effective radiated power (ERP) of 134 MW (UT is local time minus 1 h). Figure 1 shows the height profile of fp during the satellite pass as obtained with the UHF radar. It is seen that foF2 ≈4.3 MHz MHz. Further, according to the IGRF geomagnetic field model (Thébault et al., 2015), fe≈1.363 MHz at ∼215 km where fp≈f0, implying that MHz.
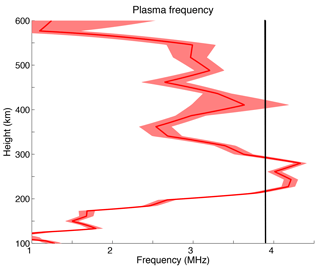
Figure 1Height profile of fp with f0=3.900 MHz shown as a solid line (14:11:15 UT and integrated for 10 s on 12 November 2015). The data were obtained with the EISCAT UHF radar from the ion line and the width of the profile shows the approximate standard deviation.
Measurements of stimulated electromagnetic emission (SEE) on the ground were attempted, but no emissions were observed during this conjunction. This is consistent with ionograms from the EISCAT Dynasonde at the Ramfjordmoen site that indicate high D-region absorption of HF waves. The pump wave may therefore have been too weak to excite SEE or the SEE itself was absorbed when propagating through the D region on its way to the ground.
CASSIOPE detected the HF wave transmitted from Heating at an altitude of 553 km, above the F-region plasma density peak at ∼250 km (Fig. 1). The RRI swept 13 different frequency bands during the experiments. Figure 2 shows an overview of the voltage on the two antenna dipoles in that frequency band which contained the Heating signal. The signal from the continuously transmitted pump wave at f0=3.900 MHz can be seen from about 14:07:34 UT. The ratio of the detected voltage magnitudes on dipoles 1 and 2 is approximately constant with and the phase difference between the two signals . The pump wave thus passed through the ionospheric density peak although f0<foF2.
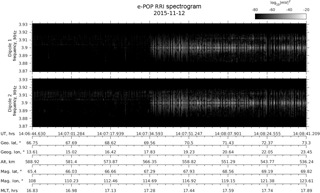
Figure 2Overview of the detected voltage on the two antenna dipoles for the CASSIOPE passage over EISCAT Heating from 14:06:44.630 to 14:08:41.209 UT on 12 November 2015. The RRI was pre-programmed to sweep between 13 different frequency bands, one of which contained the Heating signal at f0=3.900 MHz. The panels show the signal level in the 60 kHz wide frequency band around the Heating signal at f0, which can be seen from about 14:07:34 UT.
The I and Q baseband voltages induced on each of the two dipoles of the RRI were used to calculate the DOA of the detected electromagnetic field. The theory and numerical technique for inverting the voltages to the DOA is discussed by James (2017). The subject was also treated in James (2003), however, with additional approximations for the included outline of the DOA calculations. For the computations of the DOA, it is assumed that the waves obey the cold-plasma theory. In addition, fp, fe (fe≪fp, f0 for the discussed experiments) and B0 are assumed independently known and hence allow the wave polarization to be determined in a spacecraft coordinate reference system for a given propagation direction. The RRI tubular BeCu dipoles are assumed to have an effective length equal to half their tip-to-tip length permitting the induced open-circuit voltage input to the RRI to be calculated. This direction determination depends on the accuracy of the polarization measurement and on the relevance of the cold plasma theory. While this seems defensible for propagation in the upper-branch O- and X-modes at frequencies above their respective cutoff frequencies, it does require knowledge of the plasma parameters at the receiver, and can be an imprecise approach when polarization becomes longitudinal; this is, however, not a problem for the examples presented below. It has the advantages of not requiring spatially coherent receivers for wave-front detection, and of avoiding the need for absolute electric field measurement.
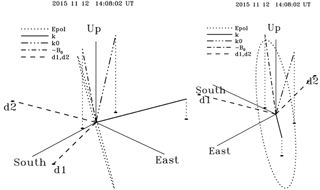
Figure 3Direction of the pump wave vector (k) detected by the RRI on CASSIOPE at an altitude of 553 km as viewed from two angles (14:08:02 UT on 12 November 2015, corresponding to the plasma profile in Fig. 1). Also shown is the direction of the straight line between Heating and CASSIOPE (k0), B0 and the two receiver dipoles (d1, d2). The vertical dotted lines indicate the projection of the vectors on the horizontal south–east plane. The dashed ellipse indicates the polarization of the wave electric field and the right diagram is from approximately normal to that ellipse. The DOA calculations were done with fp=2.00 MHz and fe=1.20 MHz at the CASSIOPE altitude.
Figure 3 shows the directions of the pump wave vector (k), the straight line between Heating and CASSIOPE (k0), B0 and the two receiver dipoles (d1, d2) for 12 November. The wave vector is directed towards the north-east and closer to horizontal than to B0, although the Heating beam was transmitted near magnetic zenith. The dashed ellipse outlines the polarization of the wave electric field with the right diagram viewing approximately normal to the polarization plane. The wave is nearly linearly polarized which is consistent with the direction of the wave vector near-orthogonal to B0.
On 26 November, the pump wave was transmitted continuously between 12:07:00 and 12:17:00 UT with f0=5.423 MHz and an ERP of 490 MW. Figure 4 shows the height profile of fp with foF2≈5.6 MHz MHz.
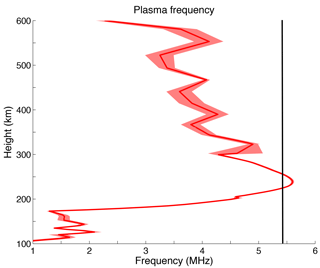
Figure 4Height profile of fp with f0=5.423 MHz shown as a solid line (12:04:50 UT and integrated for 10 s on 26 November 2015). The data were obtained from the plasma line up to ∼300 km altitude and from the ion line at higher altitudes. The width of the profile shows the approximate standard deviation. The time for the profile, a few minutes before the conjunction between the Heating beam and CASSIOPE, was the last time with a usable plasma line height profile that enables determination of fp with high accuracy.
SEE was well developed during this conjunction and exhibited downshifted maximum features in the lower sideband of the pump (Leyser, 2001). The frequency spectra indicate that f0<4fe in the region where the SEE is excited. According to the IGRF model, fe≈1.357 MHz at the plasma resonance height of approximately 225 km, which implies that f0=5.423 MHz ≲ 4fe≈5.428 MHz. However, the well-developed SEE suggests that it is excited where f0 is at least some 10 kHz below 4fe, which would indicate that the SEE is excited at a lower altitude (larger fe) than the plasma resonance height, at which kHz. The observation of SEE on 26 November is also consistent with the ionograms from the EISCAT Dynasonde that indicate low D-region absorption of HF waves, contrary to the situation on 12 November.
The RRI detected the HF wave transmitted from Heating at an altitude of 352 km, above the F2-region peak at ∼235 km (Fig. 4). Figure 5 shows an overview of the voltage on the two antenna dipoles in the frequency band that contained the Heating signal, similar to Fig. 2. The signal from the continuously transmitted pump wave at f0=5.423 MHz can be seen from about 12:11:45 UT. For this case, the detected signals have RV≈1.2 and .
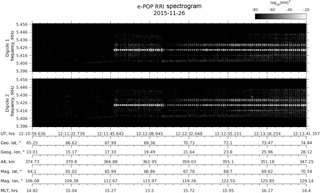
Figure 5Overview of the detected voltage on the two antenna dipoles for the CASSIOPE passage over EISCAT Heating from 12:10:59.636 to 12:13:41.357 UT on 26 November 2015. The RRI was pre-programmed to sweep between 13 different frequency bands, one of which contained the Heating signal at f0=5.423 MHz. The two panels show the signal level in the 60 kHz wide frequency band around the Heating signal at f0, which can be seen from about 12:11:45 UT.
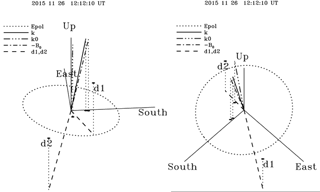
Figure 6 shows that the direction of the wave vector (k) of the detected pump wave is close to magnetic zenith. Specifically, k deviates from −B0 by only 0.14∘. As seen from the left part of Fig. 6, the electric field polarization is approximately circular, consistent with the wave vector being near-parallel to −B0.
The EISCAT Heating facility was used for transmission of a LHCP electromagnetic wave beam directed in magnetic zenith into the ionosphere with . These conditions were fulfilled for two of the six conjunctions in our experiments. In both of these conjunctions, the pump wave was detected by CASSIOPE in the topside ionosphere, above the daytime F2-region density peak. For 12 November 2015, f0=3.900 MHz and foF2≈4.3 MHz (Fig. 1). On 26 November 2015, f0=5.423 MHz and foF2≈5.6 MHz (Fig. 4). Thus, the wave propagated through the F-region peak although f0<foF2.
An O-mode wave propagating upward in a horizontally stratified ionosphere with increasing plasma density with height will reach a maximum density at which fp=f0 for angles of incidence θ≤θc, where the critical or Spitze angle (Ellis, 1956), and is the inclination of B0 at fp=f0 above Heating. For increasing θ beyond θc, an O-mode wave reflects at successively lower fp, as in magnetic zenith at .
Based on ray-tracing computations, it has been shown that a LHCP wave can be guided in the L-mode in magnetic zenith by kilometre-scale magnetic field-aligned density ducts in an otherwise horizontally stratified ionosphere (Leyser and Nordblad, 2009; Nordblad and Leyser, 2010). A wave in the L-mode has a wave vector parallel or antiparallel to the ambient magnetic field. For fp<f0, the L-mode follows the O-mode dispersion surface. Whereas the O-mode has a cutoff at fp=f0, the L-mode passes through the radio window in a horizontally stratified ionosphere for θ=θc or is guided along B0 by density ducts through radio windows that are opened by the ducts. In a horizontally stratified ionosphere, the radio window denotes that case for which waves transmitted from the ground have their wave vector antiparallel to B0 when reaching fp=f0 and thus propagate in the L-mode, which occurs for rays launched at θ=θc.
For fp>f0 the L-mode continues on the Z-mode dispersion surface, until encountering its cutoff at . A wave in the L-mode can therefore propagate in higher plasma densities and at higher ionospheric altitudes than in the O-mode.
Note that the O- and Z-mode dispersion surfaces only touch at fp=f0 for a wave vector parallel to the ambient magnetic field (Nordblad and Leyser, 2010). A real wave field propagating along ±B0 involves a range of wave vectors around the parallel direction. In order to pass through a radio window, whether the natural radio window in a horizontally stratified ionosphere or pump-induced windows by large-scale density irregularities associated with ducts, non-parallel rays therefore have to undergo O–Z conversion. This linear conversion must be considered in order to calculate the energy transmitted through the radio window. The L-mode, however, switches between the O- and Z-mode dispersion surfaces without conversion, which is one motivation for the distinction of L, O and Z-modes.
We conclude that the pump wave observed in the topside ionosphere in our experiments propagated some distance in the L-mode, particularly where fp>f0 near the F-region peak. Since in our case , the L wave did not reach its cutoff but in the topside ionosphere where fp=f0 must again have passed through a radio window and where fp<f0 continued on the O-mode dispersion surface up to CASSIOPE.
It may be noted that an electromagnetic wave that is ducted by a cylindrical density irregularity has quasi-helical ray paths wherein propagation does not pass through the axis of the duct (James, 1994). Ducted waves therefore do not have wave vectors that are strictly parallel to ±B0. Nevertheless, ray tracing computations show the ducted waves to propagate in the L-mode where fp>f0 (Leyser and Nordblad, 2009; Nordblad and Leyser, 2010). Further, strictly speaking the dispersion properties of the L-mode discussed in the present treatment concern a homogeneous plasma. The dispersion properties in the inhomogeneous plasma of a density duct should be studied in more detail.
The transionospherically propagated signals detected on 12 November were weaker than those on 26 November. There are several reasons that may have contributed to this. The ERP on 12 November was lower than on 26 November (134 and 490 MW, respectively), D-region absorption as indicated in ionograms from the EISCAT Dynasonde was higher on 12 November than on 26 November, and the weaker signals were detected at a higher altitude and larger distance from Heating than the stronger signals (altitudes 553 and 352 km, respectively).
Further, the wave fields detected by CASSIOPE correspond to different DOA. On 12 November the wave vector was closer to horizontal than parallel to −B0 (Fig. 3), while on 26 November it was parallel to −B0 (Fig. 6).
As the pump wave on 12 November propagated a further distance in the topside ionosphere than on 26 November, refraction was probably also larger in the former case, which may have contributed to the larger DOA angle. Furthermore, for 12 November, f0 was ∼0.4 MHz below foF2 which implies approximately 0.2 MHz below the L-mode cutoff at . When an L-mode wave approaches its cutoff, the ray path bends towards the horizontal in the reflection region. Since at the F-region peak the L-mode wave is only 0.2 MHz from its cutoff, the ray may have started to bend, which could have contributed to the obtained DOA. In addition, a ducted wave propagating upwards in the topside ionosphere towards decreasing plasma densities will eventually reach an ambient density for which the wave is no longer trapped in the duct. The question arises whether there could be diffraction effects when the wave exits the duct that could contribute to the observed DOA. All these possibilities should be analysed.
Transionospheric propagation of HF pump waves transmitted from the ground with f0<foF2 in the unperturbed ionosphere has been reported previously. The electric field of a beam from the Sura facility was detected by the DEMETER satellite at about 670 km altitude, near magnetic zenith (Frolov et al., 2013). This was observed for f0 down to 0.5–0.7 MHz below foF2, which corresponds to . The observations were attributed to the development of a large-scale density cavity in the evening and nighttime pump–plasma interaction region that was suggested to focus the beam and redirect it towards magnetic zenith. The cavity was proposed to result in locally underdense plasma for the O-mode wave (fp<f0) so that it could pass through the F-region peak. Transionospheric propagation was not observed during daytime, consistent with ionospheric conditions for development of large-scale cavities by HF pumping that are less favourable during daytime than during evening and nighttime.
Frolov et al. (2013) argued that conversion of the wave from O-mode to Z-mode in the bottomside ionosphere and vice versa on the topside could not explain the observations because the Z-mode was expected to be strongly absorbed where fp≈f0 in the topside. The observations were done with ERP levels of 40–150 MW during evening and nighttime with probably only a minimum of D-region absorption. In our case the ERPs were 134 and 490 MW during daytime. Assuming a D-region absorption of 6 dB, the ERP levels are comparable in the two experiments. Since in our case transionospheric propagation with f0<foF2 was observed, the absorption cannot have been too strong. We therefore suggest that L- and associated Z-mode propagation cannot be ruled out for the cases discussed by Frolov et al. (2013). L-mode propagation would explain why transionospheric propagation was indeed observed near magnetic zenith and only for , as the L-mode has its cutoff at and is evanescent for higher fp.
Andreeva et al. (2016) presented experimental results concerning large-scale density irregularities induced by the Sura facility together with tomography-like reconstruction of the ionospheric plasma density profile using VHF (very high frequency) signals from PARUS beacon satellites that were received on the ground. The results from the reconstruction of the ionospheric electron density distribution indicate that as f0 approaches foF2, density troughs may form that stretch along the entire F2 layer. Ray tracing calculations suggest that in these troughs the plasma became locally underdense for O-mode propagation so that pump energy could be transmitted through the F-region density peak into the topside ionosphere with the pump wave propagating along the geomagnetic field, thus arriving at similar conclusions as those of Frolov et al. (2013).
James et al. (2017) reported transmissions from the Sura facility to CASSIOPE at an altitude of about 1300 km, for foF2 ∼0.1 MHz above f0 of the transmitted O-mode wave. VHF/UHF transmissions from the CASSIOPE/e-POP radio beacon were received on the ground to measure total electron content. Based on tomography-like reconstruction using the received wave data, it was concluded that the transionospheric propagation was maintained by O-mode ducting in locally underdense magnetic field-aligned density irregularities.
L-mode propagation of a ducted pump wave is expected to cause stronger plasma perturbations than O-mode propagation alone and therefore to be instrumental in the magnetic zenith effect. The pump wave can be guided in the L-mode by a density duct that has been excited by the pump in the O-mode or is naturally present. Such a duct is heated by collisional absorption of the L-mode wave as it propagates first on the O-mode dispersion surface and then continues on the Z-mode dispersion surface above the O-mode reflection height. The resulting expected deepening of the duct locally moves the upper hybrid resonance height upward. Since in the L-mode the wave electric field is perpendicular to B0 at higher plasma densities than in the O-mode, the L-mode facilitates excitation of upper hybrid phenomena localized in the density depletions of small-scale striations (Vas'kov and Gurevich, 1976; Dysthe et al., 1982; Gurevich et al., 1995; Istomin and Leyser, 1997) and associated anomalous absorption deeper into the plasma (at higher ambient plasma densities) and in a wider altitude range than for pure O-mode propagation. The duct, so to speak, tells the pump wave where to propagate and the pump wave tells the duct where to deepen, which may lead to self-focusing in magnetic zenith.
The excitation of upper hybrid phenomena occurs from the L-mode on the O-mode dispersion surface, at least initially. For small-scale striations with sufficiently deep density depletions, the L-mode with its perpendicular electric field and propagation on the Z-mode surface at altitudes above the O-mode reflection height could excite upper hybrid phenomena localized in the depletions even above the ambient plasma resonance height. Because of its possibility to propagate above the O-mode reflection height, pump wave propagation in the L-mode is in any case expected to cause additional heating and plasma depletion than for O-mode propagation alone. L-mode propagation, therefore, could account for the strong plasma response observed in magnetic zenith. Already, early experiments in the 1970s showed that HF pumping can facilitate L-mode propagation and associated O–Z conversion, as evidenced by the appearance of so-called Z traces in ionograms (Utlaut and Violette, 1974).
Ducted L-mode propagation of the pump wave can explain previously observed slow temporal evolution of optical emissions from the O(1S) excited state at 557.7 nm. In experiments at HAARP, the emissions were observed to grow for tens of seconds after pump-on, which is slow compared to the ∼0.7 s lifetime of the source exited state (Pedersen et al., 2003). The slow growth was attributed to larger-scale transport processes under self-focusing to produce intensified pumping and the electron acceleration needed to excite the O(1S) state. We note that the slow temporal evolution is consistent with the formation of density irregularities that guide the pump wave in the L-mode, which could facilitate intensified electron acceleration by the LHCP wave (Istomin and Leyser, 2003).
Strong self-focusing was observed at HAARP in which the pump-induced 557.7 nm emission region collapsed and intensified from a cone of to 9∘ in magnetic zenith within tens of seconds after pump-on (Kosch et al., 2007). Again the emissions had a growth time at least 1 order of magnitude longer than the lifetime of the O(1S) state, indicative of larger-scale plasma structuring. The optical emission images showed evidence of magnetic field-aligned density striations with transverse scales of ∼2–6 km. We suggest that such irregularities guided the pump wave in the L-mode in magnetic zenith, which facilitated intensified pumping of upper hybrid processes and associated electron acceleration in an extended height range as well as the self-focusing.
Finally it should be mentioned that the magnetic zenith effect has been interpreted in terms of self-focusing of the pump wave (Gurevich et al., 2001, 2002). These treatments too are concerned with large-scale structuring of the plasma by bunching of small-scale density striations, similar to the formation of ducts discussed by Leyser and Nordblad (2009); Nordblad and Leyser (2010). However, whereas Gurevich et al. (2001, 2002) propose self-focusing of an O-mode pump wave, the present results, those of Leyser and Nordblad (2009) and Nordblad and Leyser (2010) suggest the importance of L-mode propagation deeper into the plasma where an O-mode wave cannot reach. Further experimental investigations and modelling of the magnetic zenith effect are needed to find out the importance of O-mode versus L-mode pumping for the magnetic zenith effect.
The EISCAT Heating facility was used to transmit LHCP pump waves into the ionosphere in a beam directed towards magnetic zenith, with f0 a few hundred kilohertz below foF2 such that . Measurements of plasma parameter values, including the electron concentration height profile, were done with the EISCAT UHF incoherent scatter radar. Transmitted HF pump signals were detected by the RRI instrument in the e-POP package aboard the CASSIOPE spacecraft in the topside ionosphere above the daytime F-region density peak. The transionospheric propagation is interpreted in terms of propagation in the L-mode and associated O–Z conversion through pump-induced radio windows both in the bottomside and topside F region, consistent with previous predictions (Leyser and Nordblad, 2009; Nordblad and Leyser, 2010). We propose that propagation of pump waves in the L-mode is an ingredient in explaining the magnetic zenith effect, but further experiments are needed to find out the role of pure O-mode versus L-mode propagation in magnetic zenith.
Access to the raw data may be provided upon reasonable request to the authors.
The authors declare that they have no conflict of interest.
EISCAT is an international association supported by research organizations in
China (CRIRP), Finland (SA), Japan (NIPR and STEL), Norway (NFR), Sweden (VR)
and the United Kingdom (NERC). The CASSIOPE/e-POP mission is funded through
a Government of Canada Contribution Agreement among the Canadian Space
Agency, the MDA Corporation, and the Industrial Technologies Office of
Innovation, Science and Economic Development Canada.
The topical editor, Ana G. Elias, thanks Michael Kosch and one anonymous referee for help in evaluating this paper.
Andreeva, E. S., Frolov, V. L., Kunitsyn, V. E., Kryukovskii, A. S., Lukin, D. S., Nazarenko, M. O., and Padokhin, A. M.: Radiotomography and HF ray tracing of the artificially disturbed ionosphere above the Sura heating facility, Radio Sci., 51, 638–644, https://doi.org/10.1002/2015RS005939, 2016. a
Blagoveshchenskaya, N. F., Borisova, T., Kornienko, V., Leyser, T., Rietveld, M., and Thidé, B.: Artificial field-aligned irregularities in the nightside auroral ionosphere, Adv. Space Res., 38, 2503–2510, https://doi.org/10.1016/j.asr.2004.12.008, 2006. a
Dysthe, K. B., Mjølhus, E., Pécseli, H., and Rypdal, K.: Thermal cavitons, Phys. Scripta, T2/2, 548–559, 1982. a
Ellis, G. R.: The Z propagation hole in the ionosphere, J. Atmos. Terr. Phys., 8, 43–54, https://doi.org/10.1016/0021-9169(56)90090-3, 1956. a
Frolov, V., Mityakov, N., Shorokhova, E., and Parrot, M.: Structure of the Electric Field of a High-Power Radio Wave in the Outer Ionosphere, Radiophys. Quantum El., 56, 325–343, https://doi.org/10.1007/s11141-013-9437-x, 2013. a, b, c, d
Gurevich, A., Carlson, H., and Zybin, K.: Nonlinear structuring and southward shift of a strongly heated region in ionospheric modification, Phys. Lett. A, 288, 231–239, 2001. a, b
Gurevich, A., Zybin, K., Carlson, H., and Pedersen, T.: Magnetic zenith effect in ionospheric modifications, Phys. Lett. A, 305, 264–274, https://doi.org/10.1016/S0375-9601(02)01450-0, 2002. a, b
Gurevich, A. V., Zybin, K. P., and Lukyanov, A. V.: Stationary striations developed in the ionospheric modification, Phys. Rev. Lett., 75, 2622–2625, 1995. a
Gustavsson, B., Sergienko, T., Rietveld, M. T., Honary, F., Steen, Å., Brändström, B. U. E., Leyser, T. B., Arulia, A., Aso, T., and Ejiri, M.: First tomographic estimate of volume distribution of enhanced airglow emission caused by HF pumping, J. Geophys. Res., 106, 29105–29123, https://doi.org/10.1029/2000JA900167, 2001. a
Honary, F., Borisov, N., Beharrell, M., and Senior, A.: Temporal development of the magnetic zenith effect, J. Geophys. Res., 116, A06309, https://doi.org/10.1029/2010JA016029, 2011. a
Istomin, Y. N. and Leyser, T. B.: Small-scale magnetic field-aligned density irregularities excited by a powerful electromagnetic wave, Phys. Plasmas, 4, 817–828, 1997. a
Istomin, Y. N. and Leyser, T. B.: Electron acceleration by cylindrical upper hybrid oscillations trapped in density irregularities in the ionosphere, Phys. Plasmas, 10, 2962–2970, 2003. a
James, H., King, E., White, A., Hum, R., Lunscher, W., and Siefring, C.: The e-POP Radio Receiver Instrument on CASSIOPE, Space Sci. Rev., 189, 79–105, https://doi.org/10.1007/s11214-014-0130-y, 2015. a
James, H. G.: Three-dimensional ray paths in cylindrical ducts: Upper branch cold plasma O and X modes, Radio Sci., 29, 1201–1214, https://doi.org/10.1029/94RS01539, 1994. a
James, H. G.: High-frequency direction finding in space, Rev. Sci. Instrum., 74, 3478–3486, https://doi.org/10.1063/1.1581396, 2003. a
James, H. G.: Propagation directions of high-frequency waves in the topside ionosphere, Radio Sci., in review, 2018. a, b
James, H. G., Frolov, V. L., Andreeva, E. S., Padokhin, A. M., and Siefring, C. L.: Sura heating facility transmissions to the CASSIOPE/e-POP satellite, Radio Sci., 52, 259–270, https://doi.org/10.1002/2016RS006190, 2017. a
Kosch, M. J., Rietveld, M. T., Hagfors, T., and Leyser, T. B.: High-latitude HF-induced airglow displaced equatorwards of the pump beam, Geophys. Res. Lett., 27, 2817–2820, https://doi.org/10.1029/2000GL003754, 2000. a
Kosch, M. J., Pedersen, T., Mishin, E., Starks, M., Gerken-Kendall, E., Sentman, D., Oyama, S., and Watkins, B.: Temporal evolution of pump beam self-focusing at the High-Frequency Active Auroral Research Program, J. Geophys. Res., 112, A08304, https://doi.org/10.1029/2007JA012264, 2007. a, b
Leyser, T. B.: Stimulated electromagnetic emissions by high-frequency electromagnetic pumping of the ionospheric plasma, Space Sci. Rev., 98, 223–328, 2001. a
Leyser, T. B. and Nordblad, E.: Self-focused radio frequency L wave pumping of localized upper hybrid oscillations in high-latitude ionospheric plasma, Geophys. Res. Lett., 36, L24105, https://doi.org/10.1029/2009GL041438, 2009. a, b, c, d, e, f
Nordblad, E. and Leyser, T. B.: Ray tracing analysis of L mode pumping of the ionosphere, with implications for the magnetic zenith effect, Ann. Geophys., 28, 1749–1759, https://doi.org/10.5194/angeo-28-1749-2010, 2010. a, b, c, d, e, f, g
Pedersen, T. R. and Carlson, H. C.: First observations of HF heater-produced airglow at the High Frequency Active Auroral Research Program facility: Thermal excitation and spatial structuring, Radio Sci., 36, 1013–1026, https://doi.org/10.1029/2000RS002399, 2001. a
Pedersen, T. R., McCarrick, M., Gerken, E., Selcher, C., Sentman, D., Carlson, H. C., and Gurevich, A.: Magnetic zenith enhancement of HF radio-induced airglow production at HAARP, Geophys. Res. Lett., 30, 1169, https://doi.org/10.1029/2002GL016096, 2003. a
Rietveld, M. T., Kosch, M. J., Blagoveshchenskaya, N. F., Kornienko, V. A., Leyser, T. B., and Yeoman, T. K.: Ionospheric electron heating, optical emissions, and striations induced by powerful HF radio waves at high latitudes: Aspect angle dependence, J. Geophys. Res., 108, 1141, https://doi.org/10.1029/2002JA009543, 2003. a, b, c
Rietveld, M. T., Senior, A., Markkanen, J., and Westman, A.: New capabilities of the upgraded EISCAT high-power HF facility, Radio Sci., 51, 1533–1546, https://doi.org/10.1002/2016RS006093, 2016. a
Stix, T. H.: Waves in plasmas, Waves in a Cold Uniform Plasma, Springer, New York, 25–46, 1992. a
Tereshchenko, E. D., Khudukon, B. Z., Gurevich, A. V., Zybin, K. P., Frolov, V. L., Myasnikov, E. N., Muravieva, N. V., and Carlson, H. C.: Radio tomography and scintillation studies of ionospheric electron density modification caused by a powerful HF-wave and magnetic zenith effect at mid-latitudes, Phys. Lett. A, 325, 381–388, https://doi.org/10.1016/j.physleta.2004.03.055, 2004. a
Thébault, E., Finlay, C. C., Beggan, C. D., Alken, P., Aubert, J., Barrois, O., Bertrand, F., Bondar, T., Boness, A., Brocco, L., Canet, E., Chambodut, A., Chulliat, A., Coïsson, P., Civet, F., Du, A., Fournier, A., Fratter, I., Gillet, N., Hamilton, B., Hamoudi, M., Hulot, G., Jager, T., Korte, M., Kuang, W., Lalanne, X., Langlais, B., Léger, J.-M., Lesur, V., Lowes, F. J., Macmillan, S., Mandea, M., Manoj, C., Maus, S., Olsen, N., Petrov, V., Ridley, V., Rother, M., Sabaka, T. J., Saturnino, D., Schachtschneider, R., Sirol, O., Tangborn, A., Thomson, A., Tøffner-Clausen, L., Vigneron, P., Wardinski, I., and Zvereva, T.: International Geomagnetic Reference Field: the 12th generation, Earth Planet. Space, 67, 79, https://doi.org/10.1186/s40623-015-0228-9, 2015. a
Utlaut, W. F. and Violette, E. J.: A summary of vertical incidence radio observations of ionospheric modification, Radio Sci., 9, 895–903, https://doi.org/10.1029/RS009i011p00895, 1974. a
Vas'kov, V. V. and Gurevich, A. V.: Nonlinear resonant instability of a plasma in the field of an ordinary electromagnetic wave, J. Exp. Theor. Phys., 42, 91–97, 1976. a
Yau, A. W. and James, H. G.: CASSIOPE enhanced polar outflow probe (e-POP) mission overview, Space Sci. Rev., 189, 3–14, https://doi.org/10.1007/s11214-015-0135-1, 2015. a


